
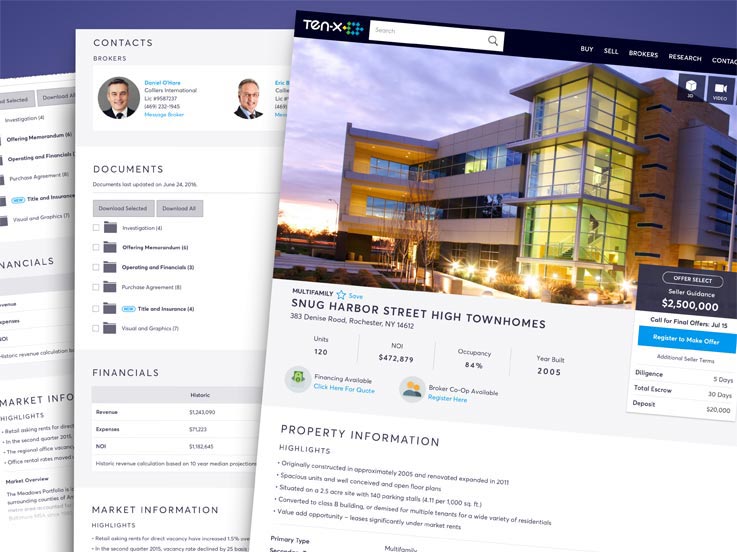
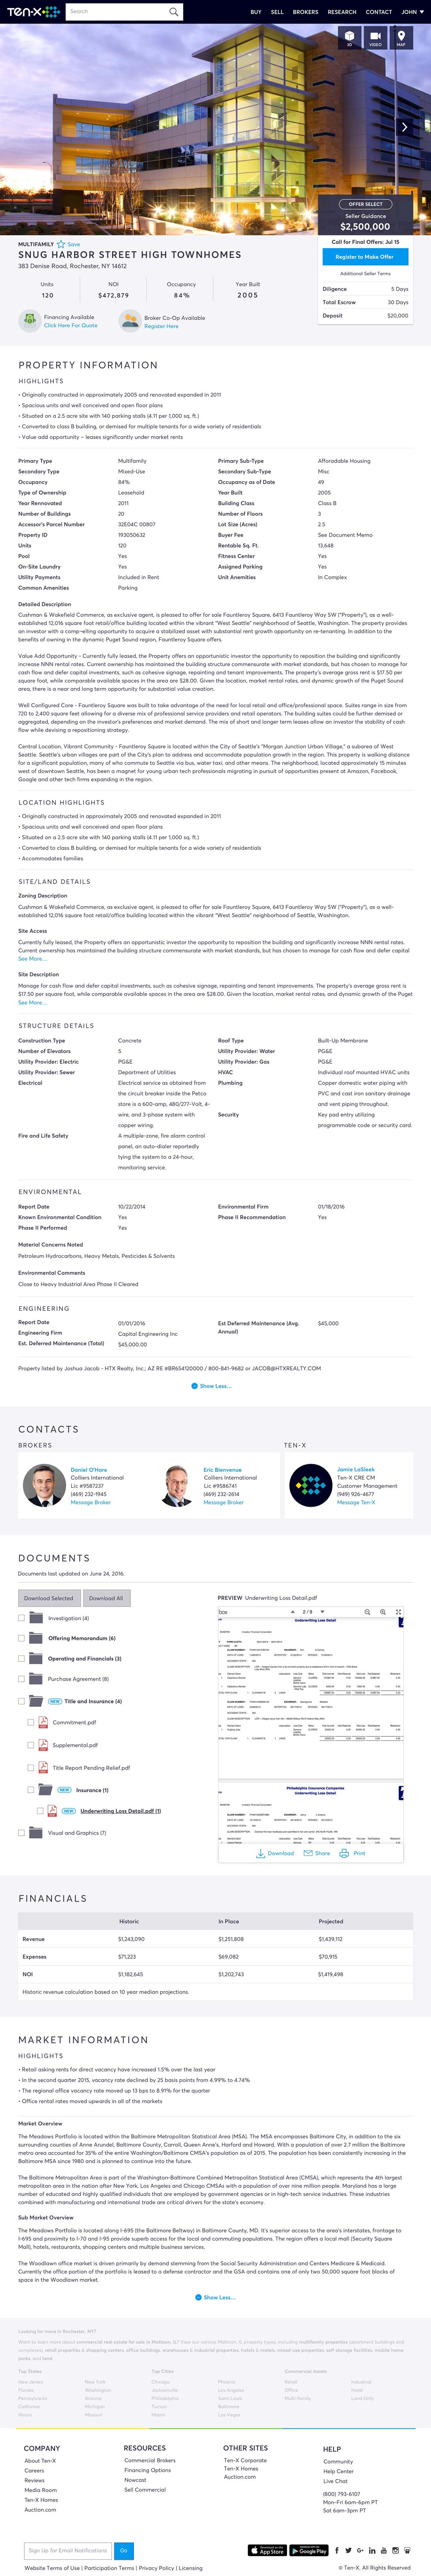
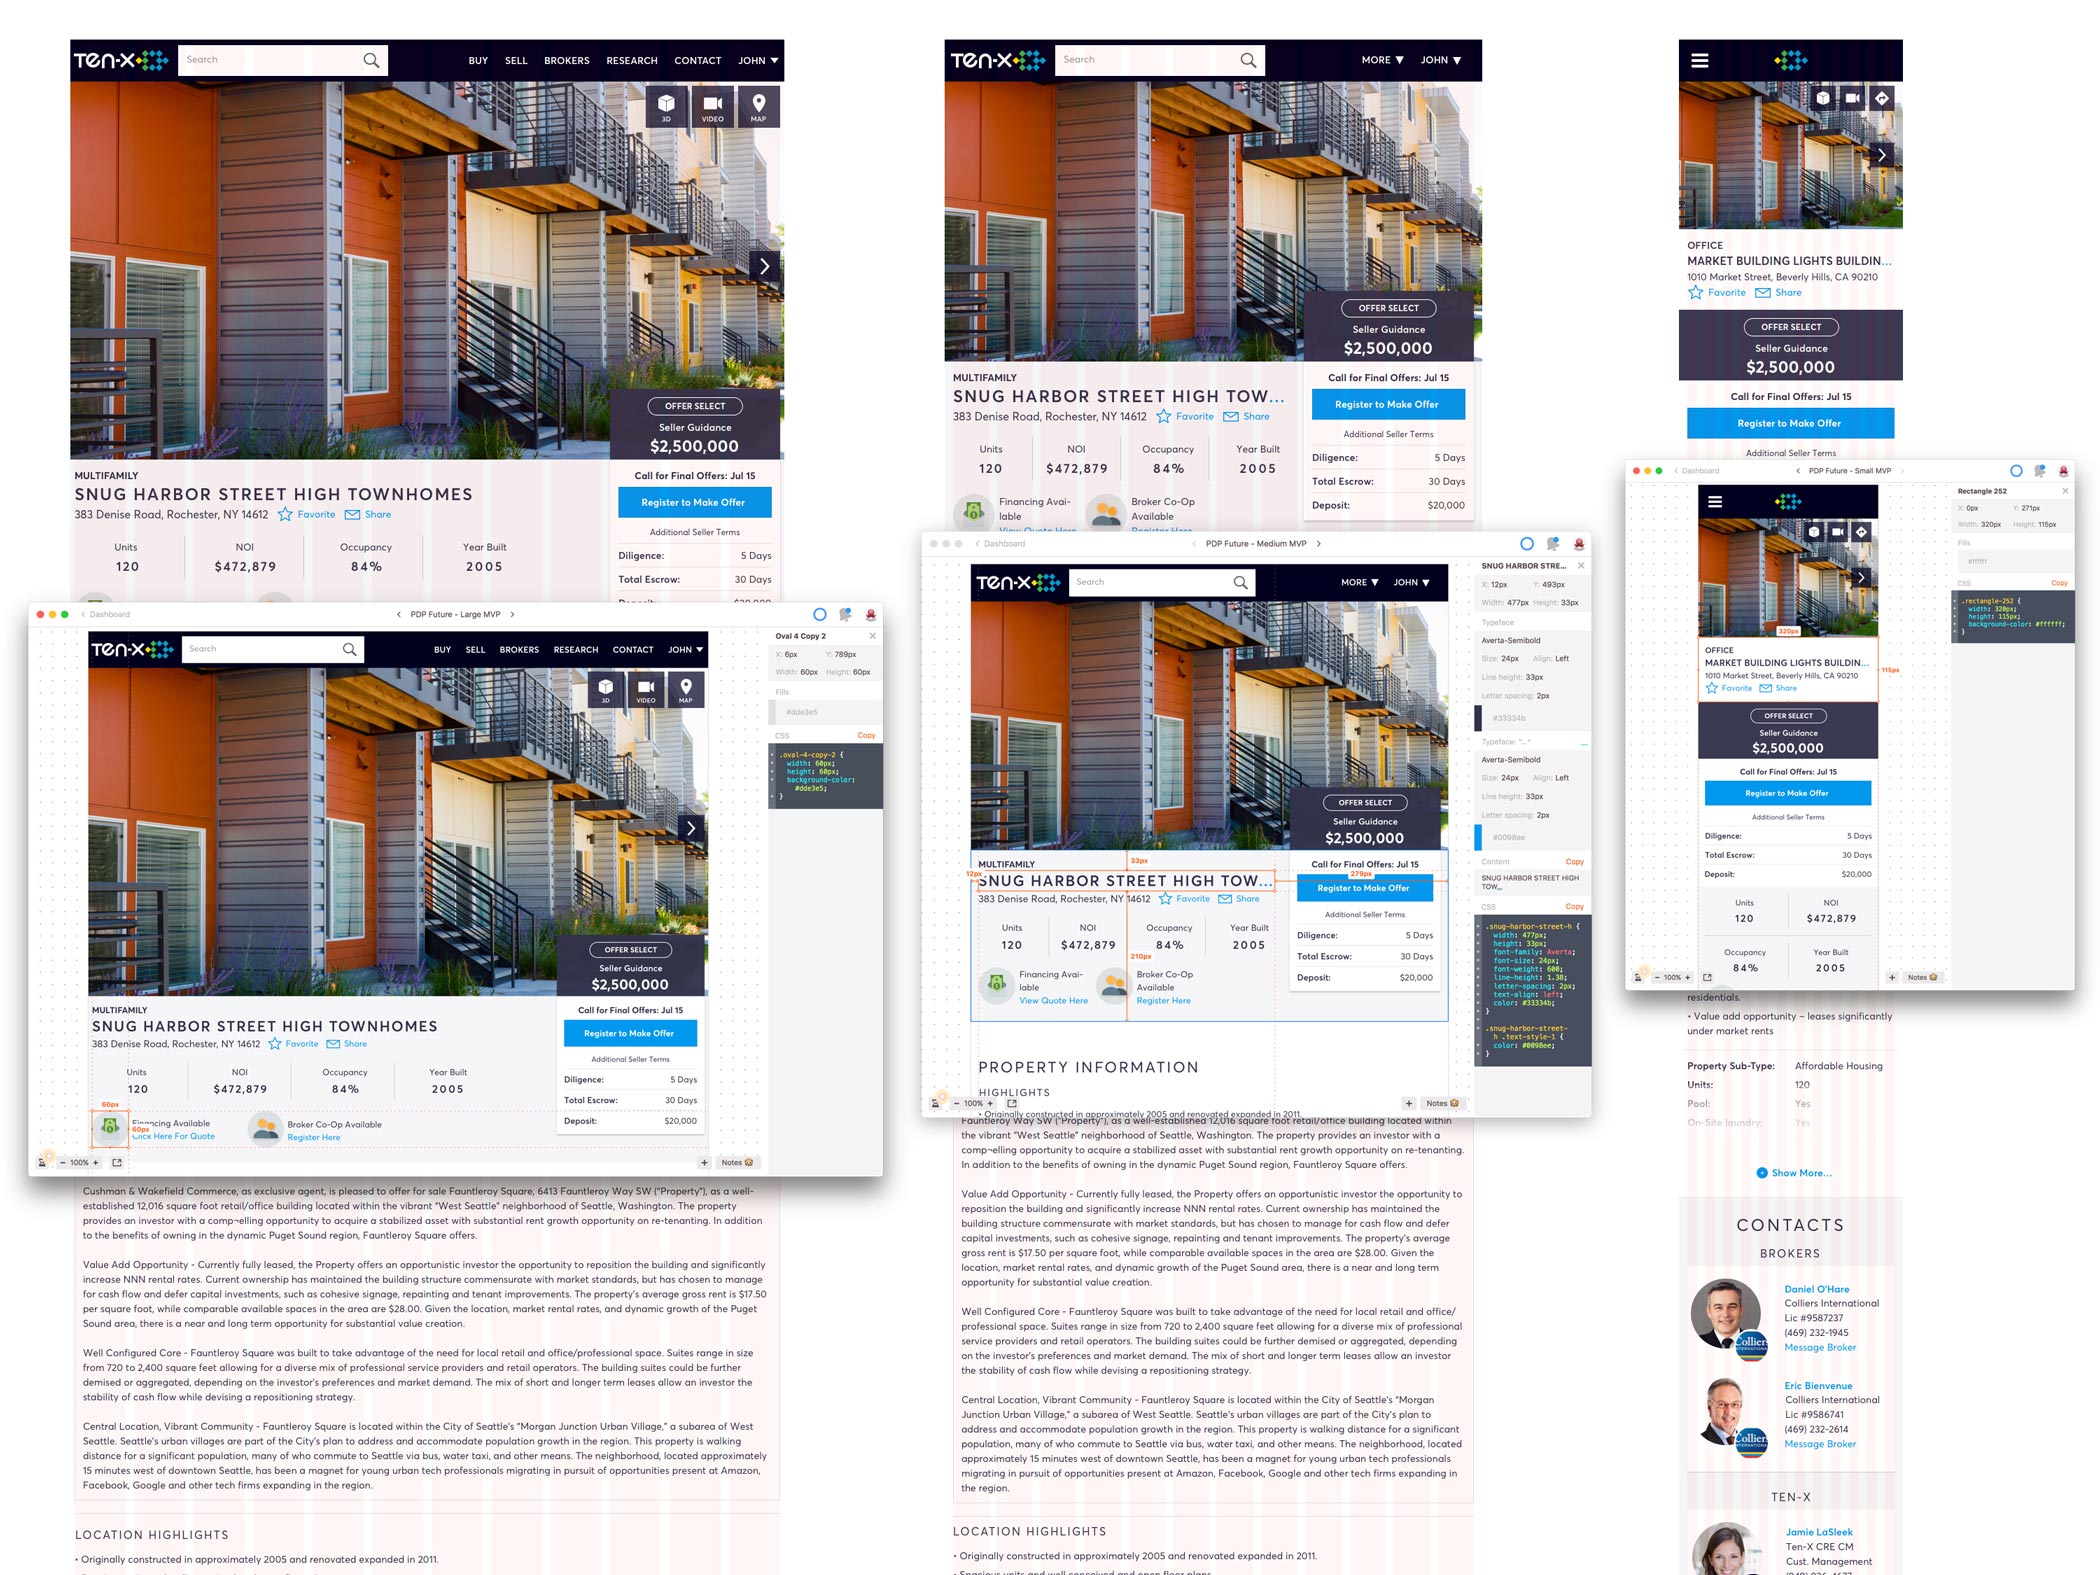
FINAL PRODUCT
Full Product Detail Page (PDP)
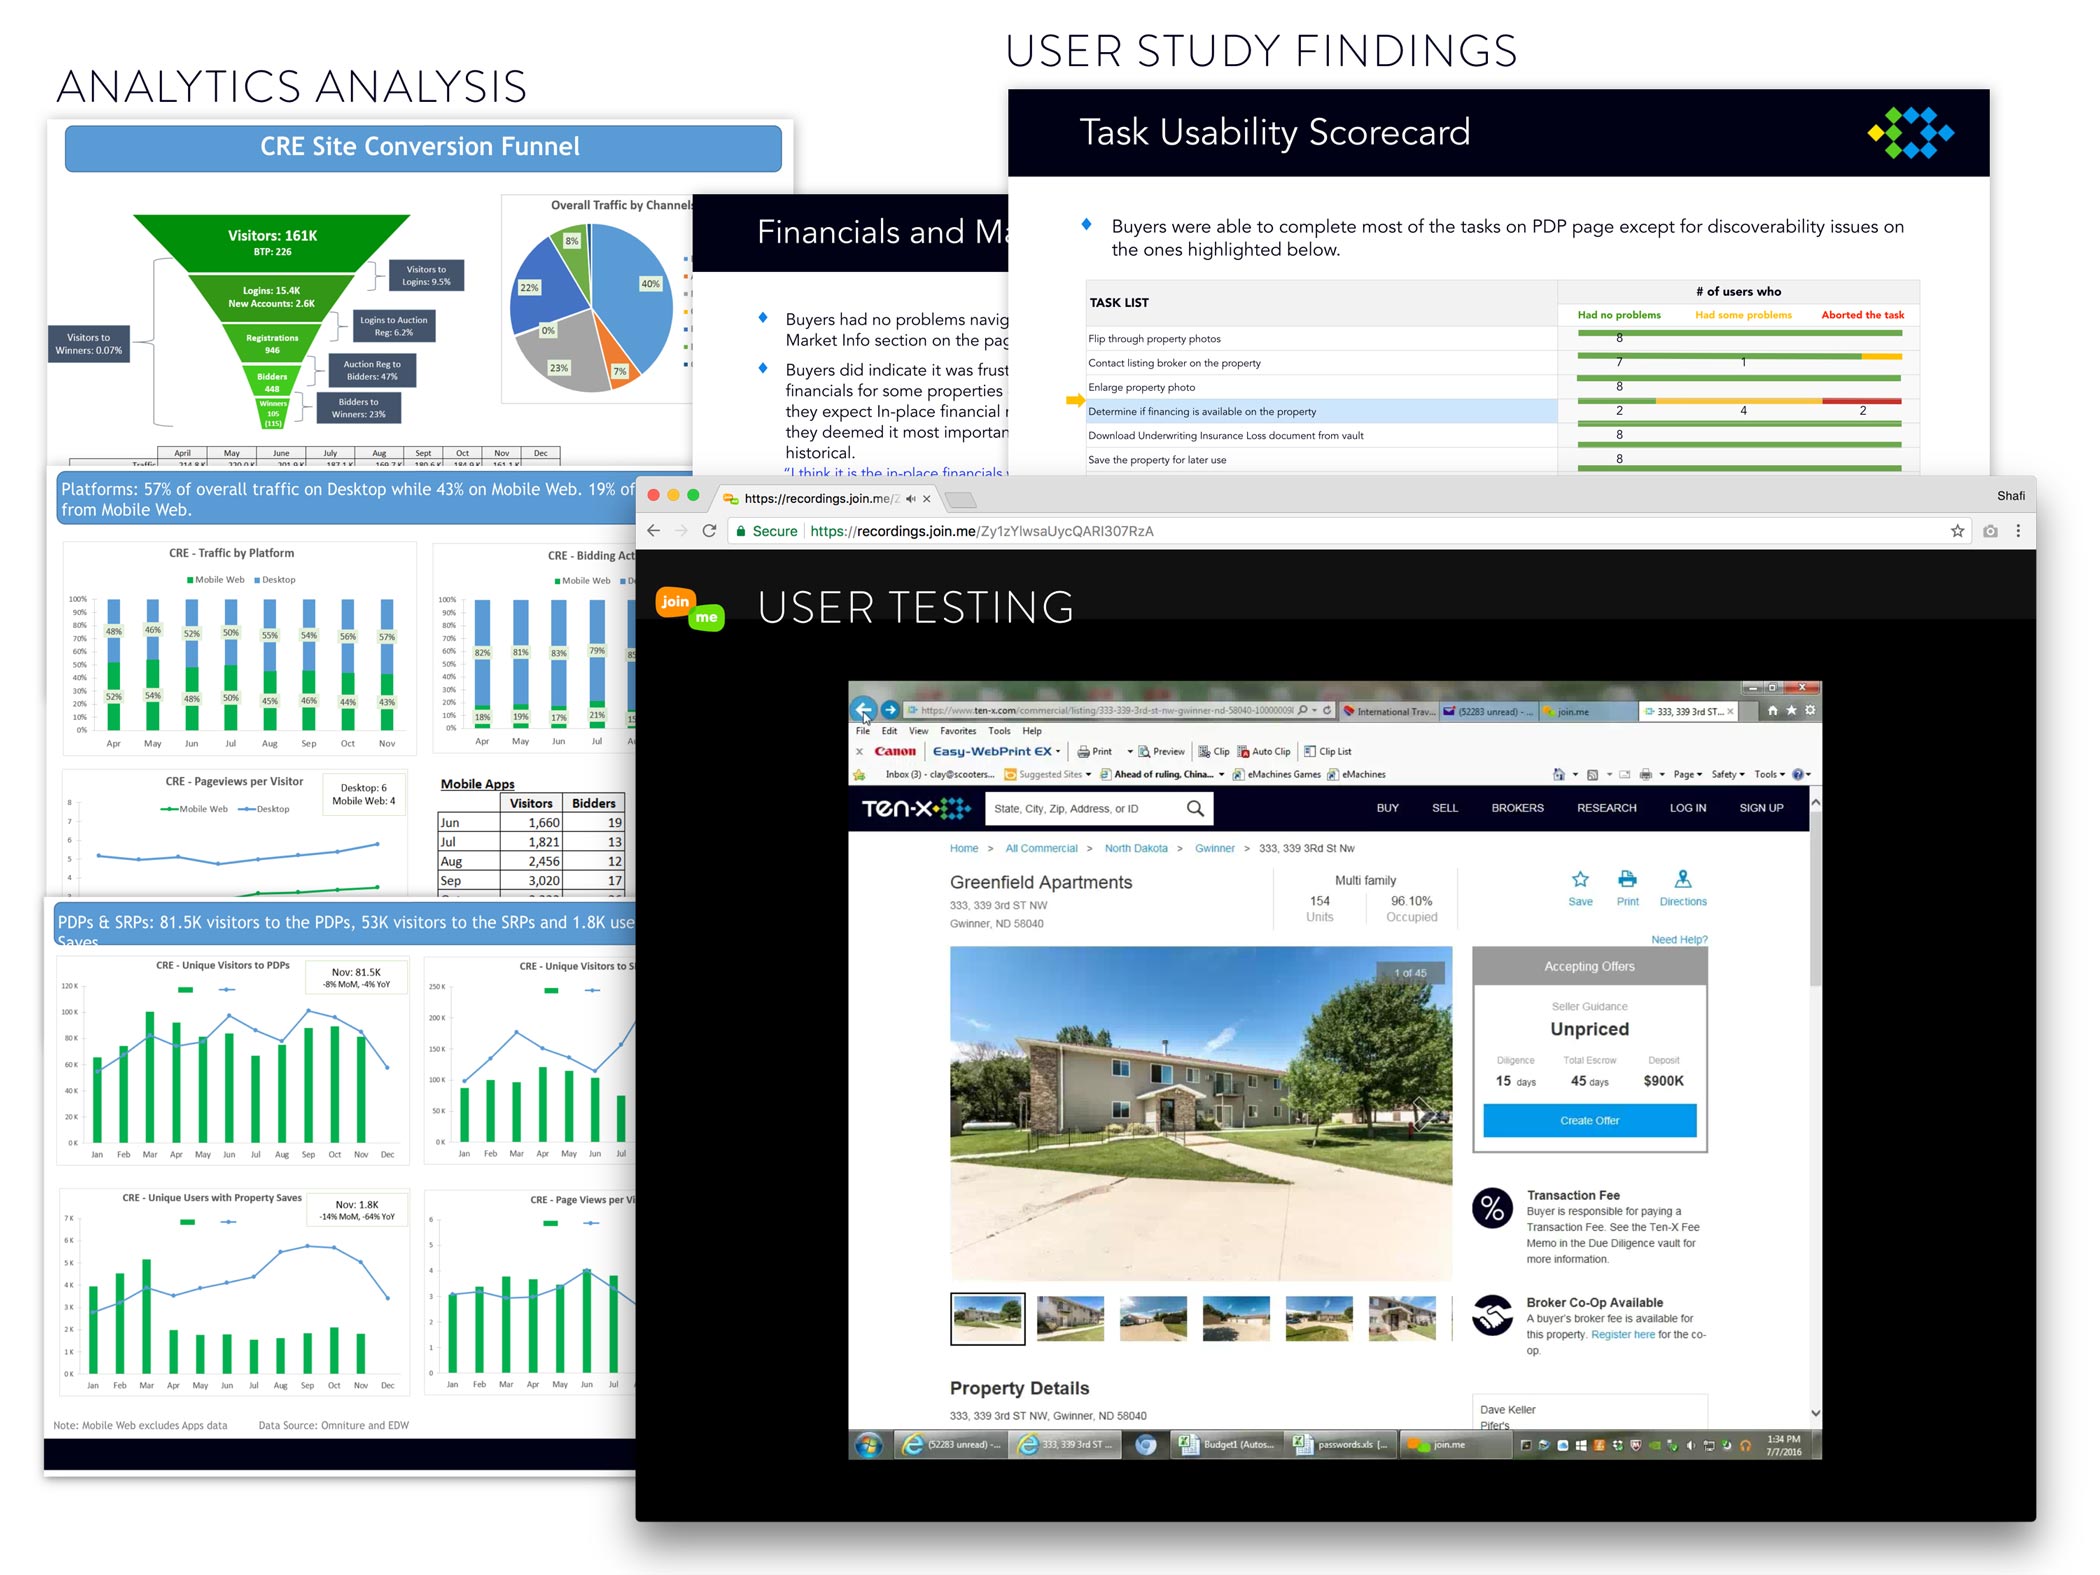
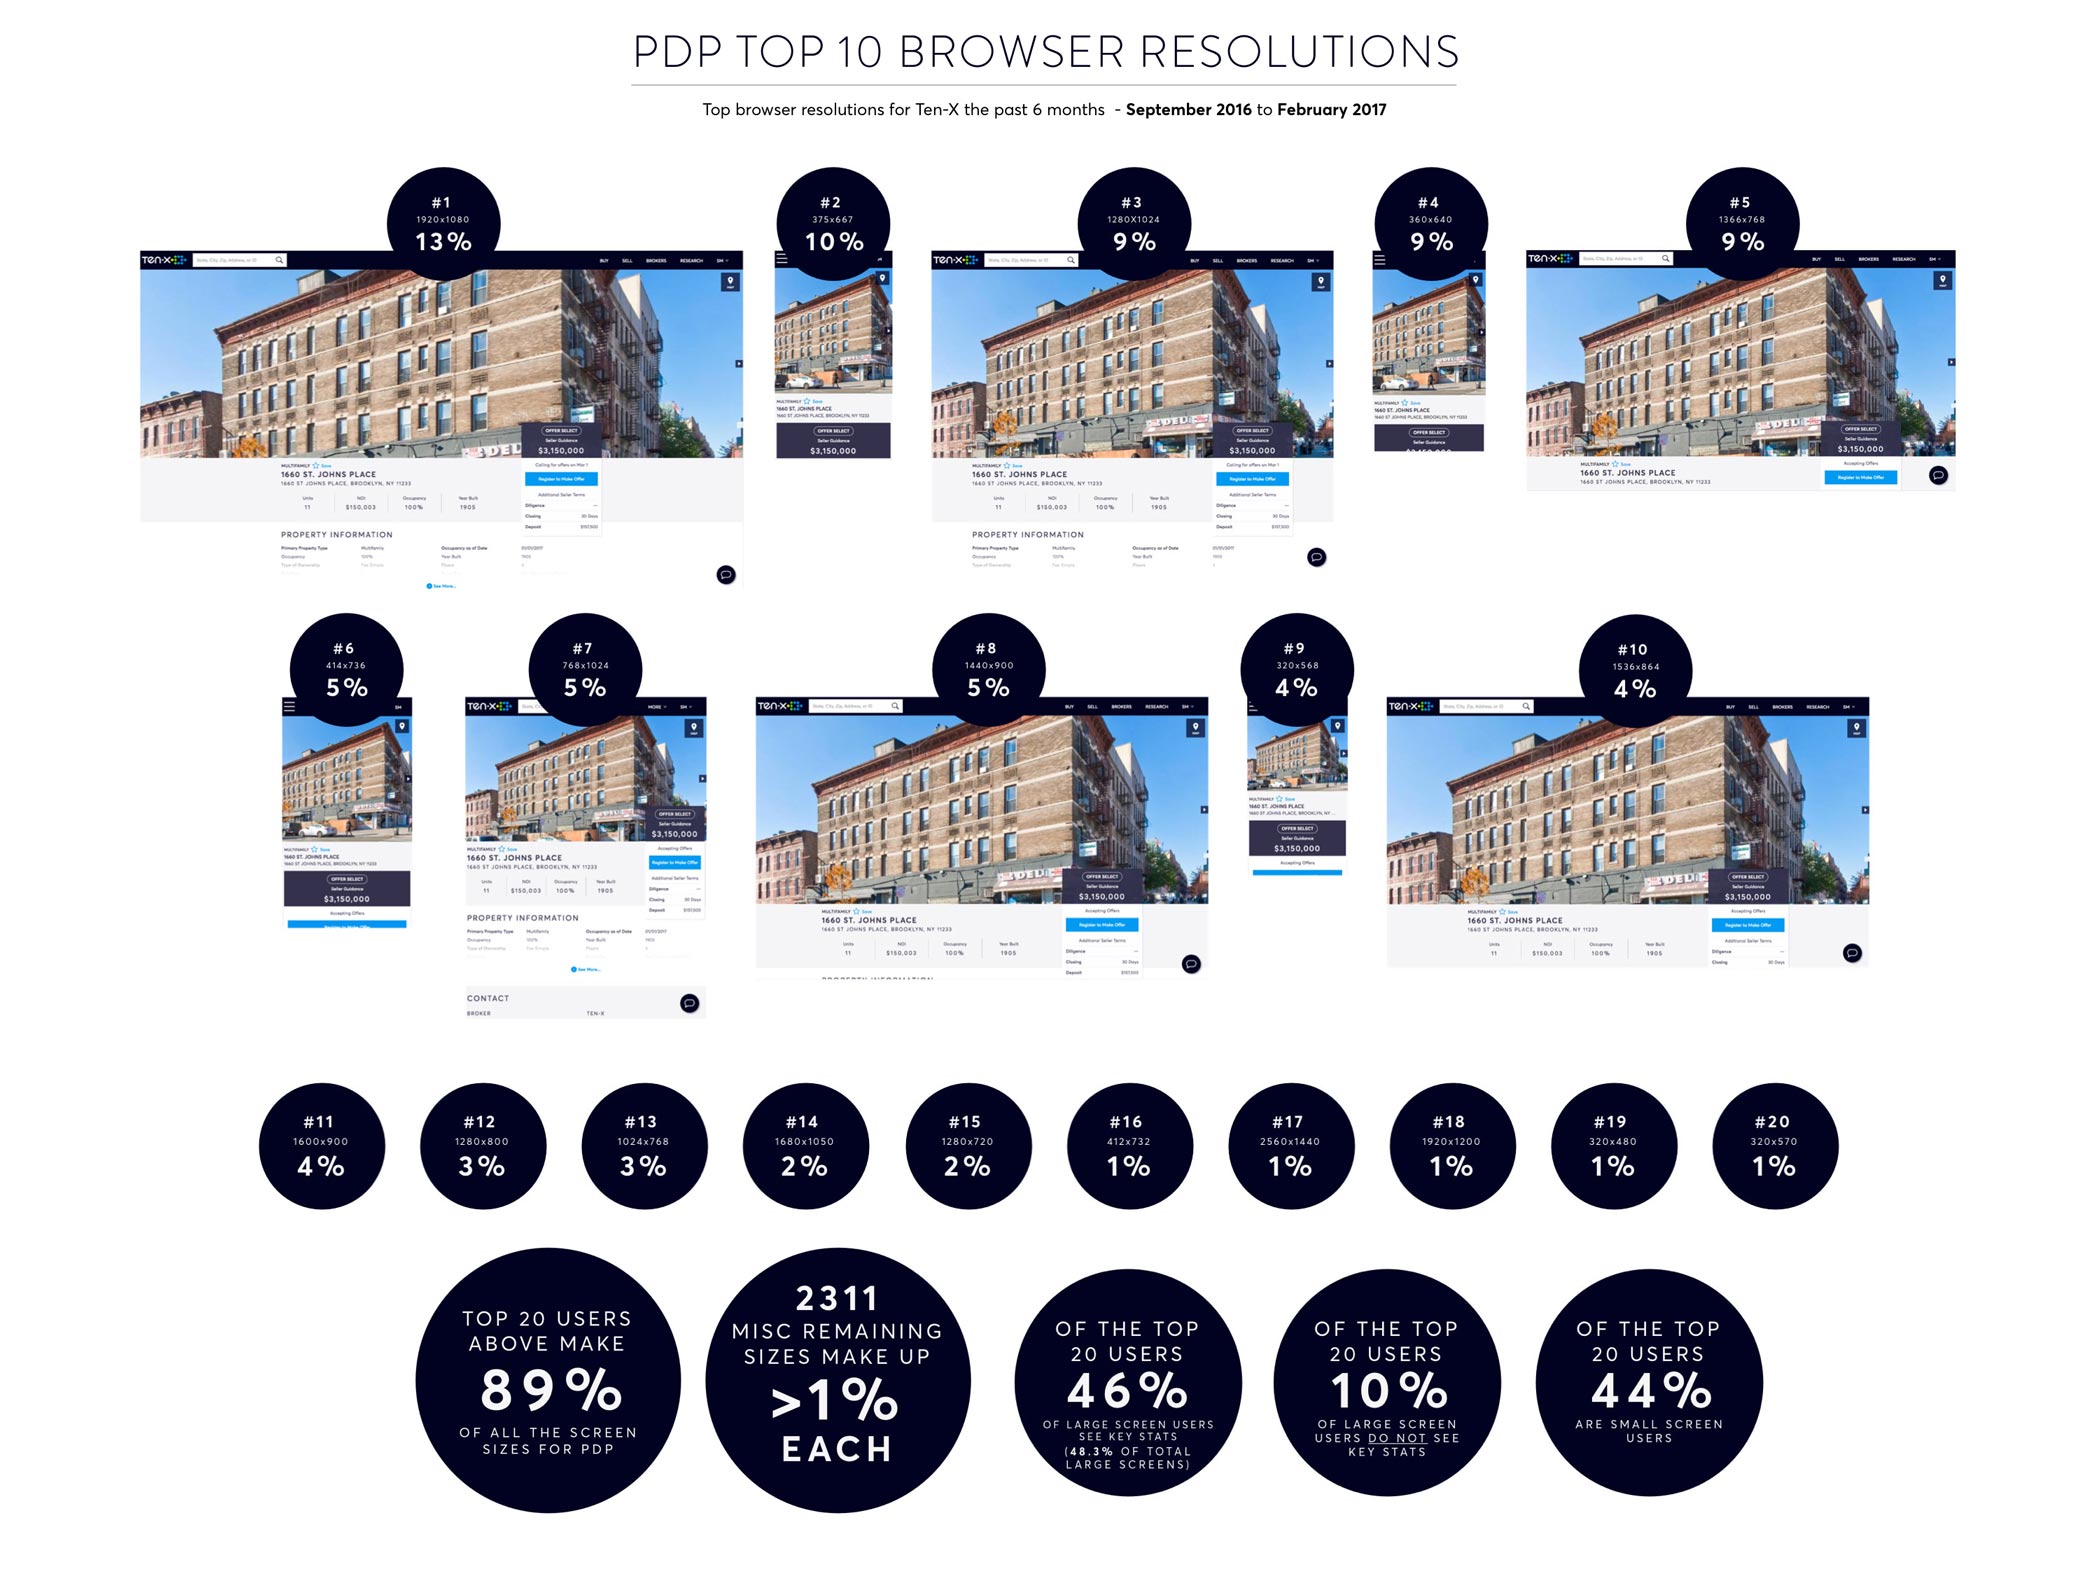
UNDERSTAND PHASE (Analytics, Research, User Testing)
I created user tasks and worked with the Customer Experience team to gather users for testing & feedback. I also worked with the analytics team to breakdown the current data.
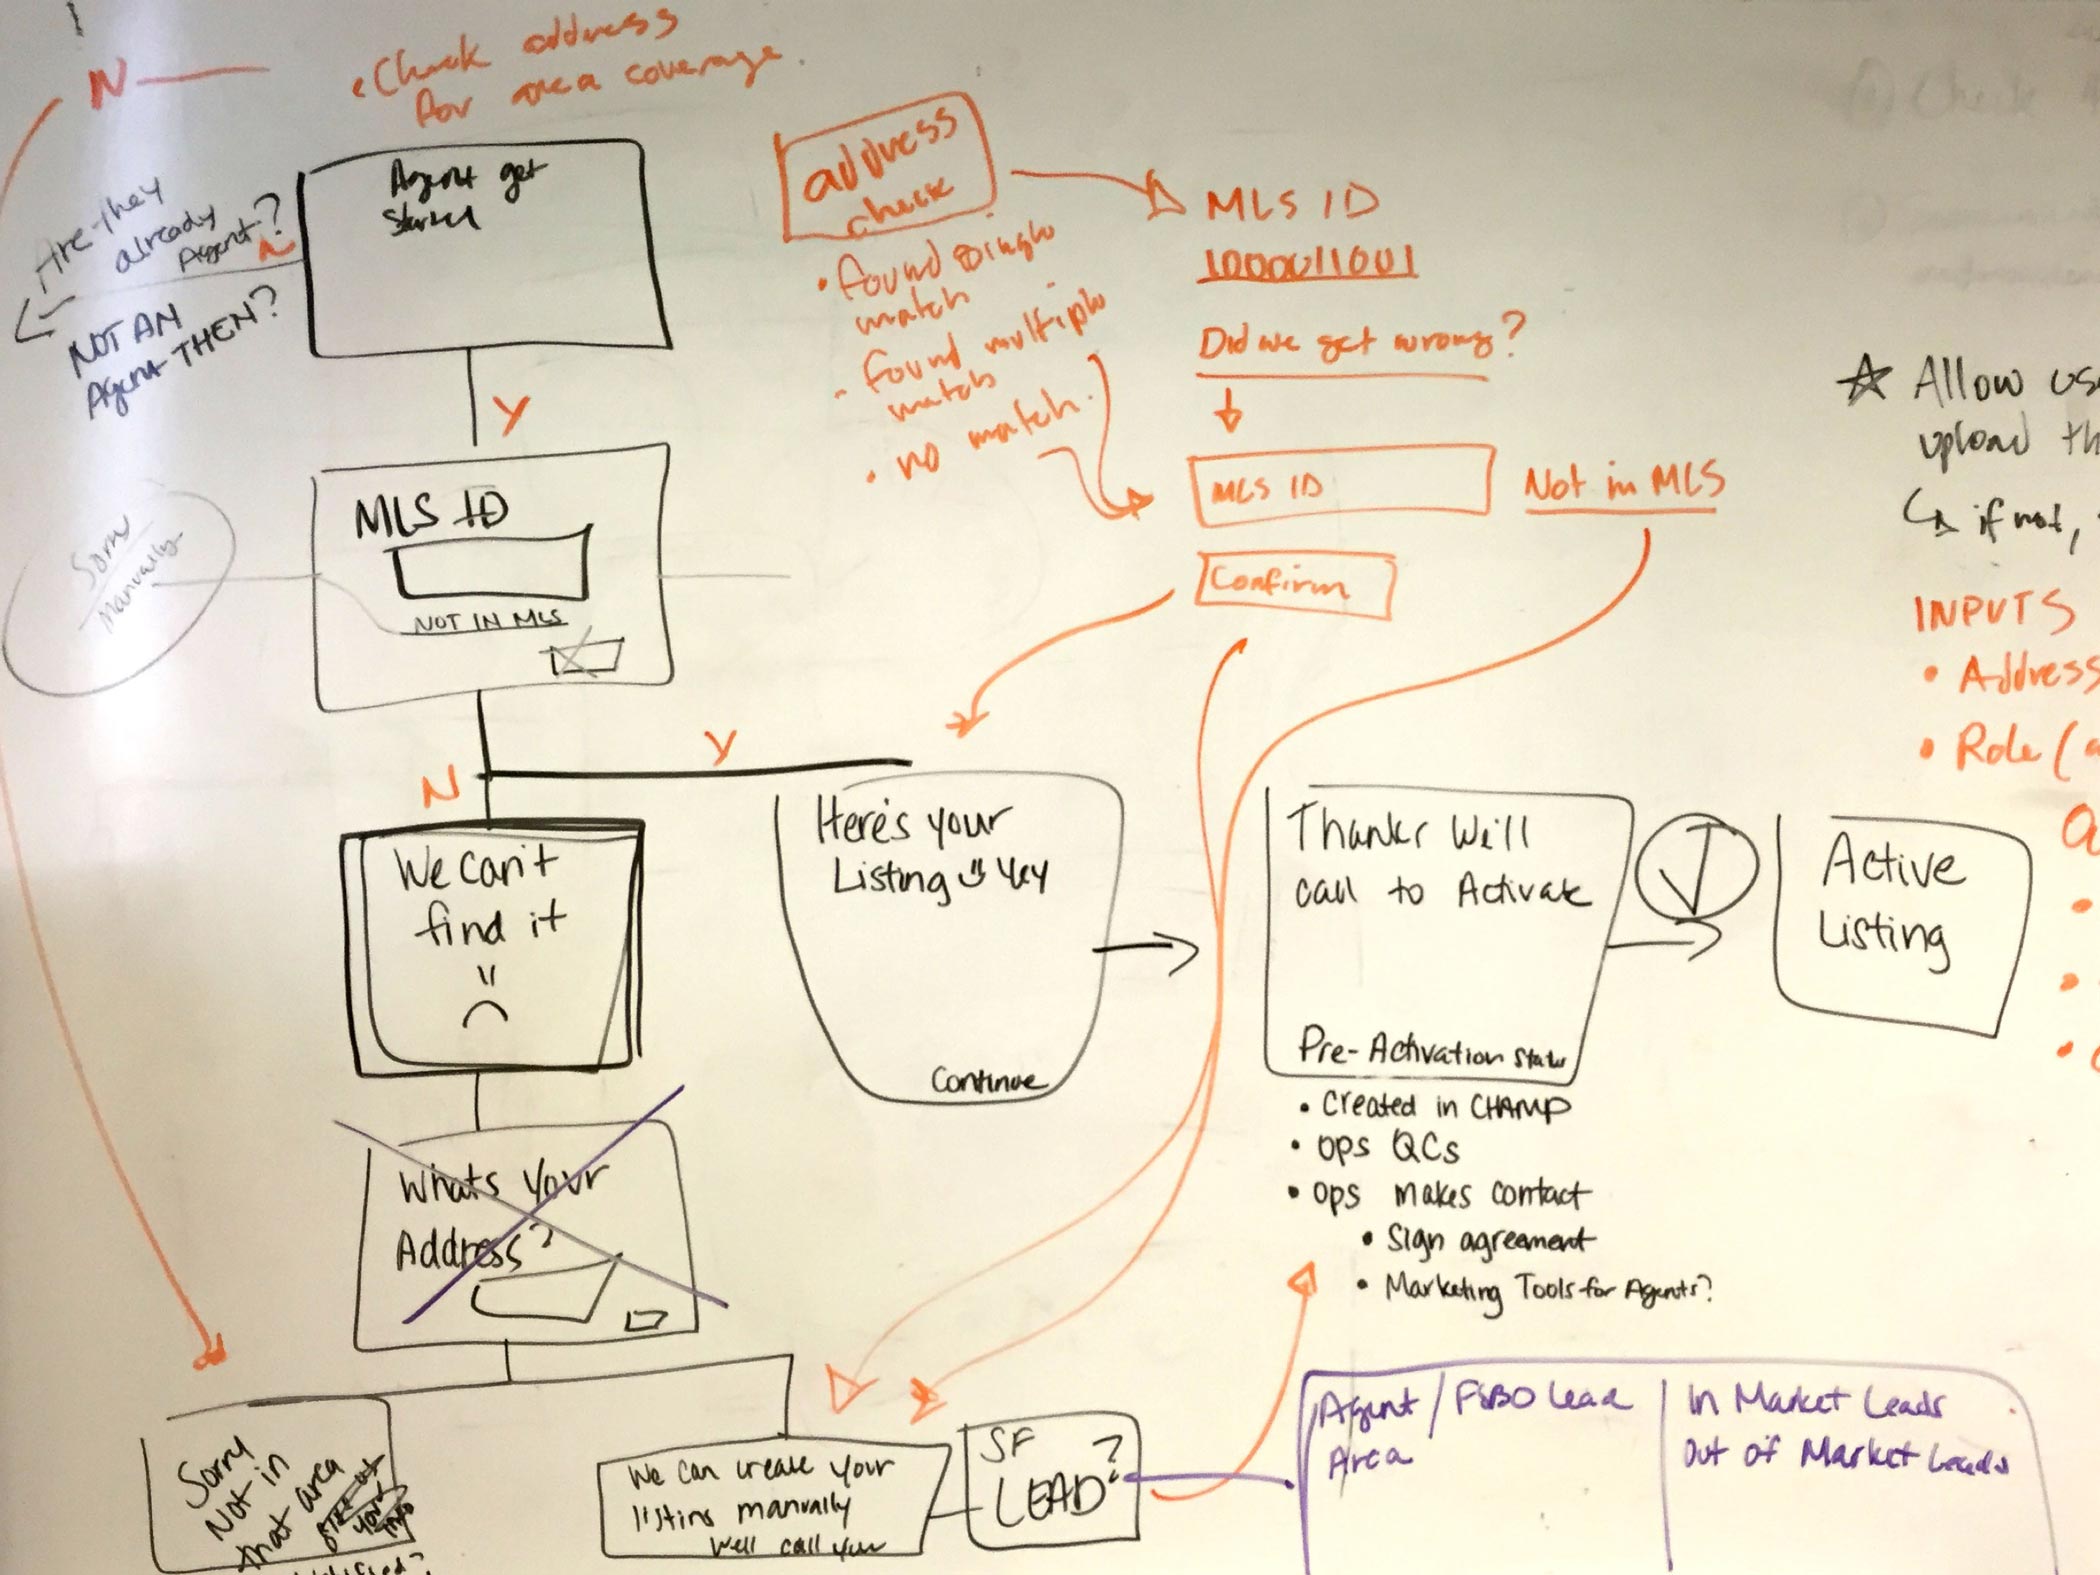
UNDERSTAND PHASE (Whiteboarding)
I did several brainstorm sessions with the product team to define user needs, goals, constraints and assumptions. Other sessions include end-to-end experiences, uses cases, user journeys etc.
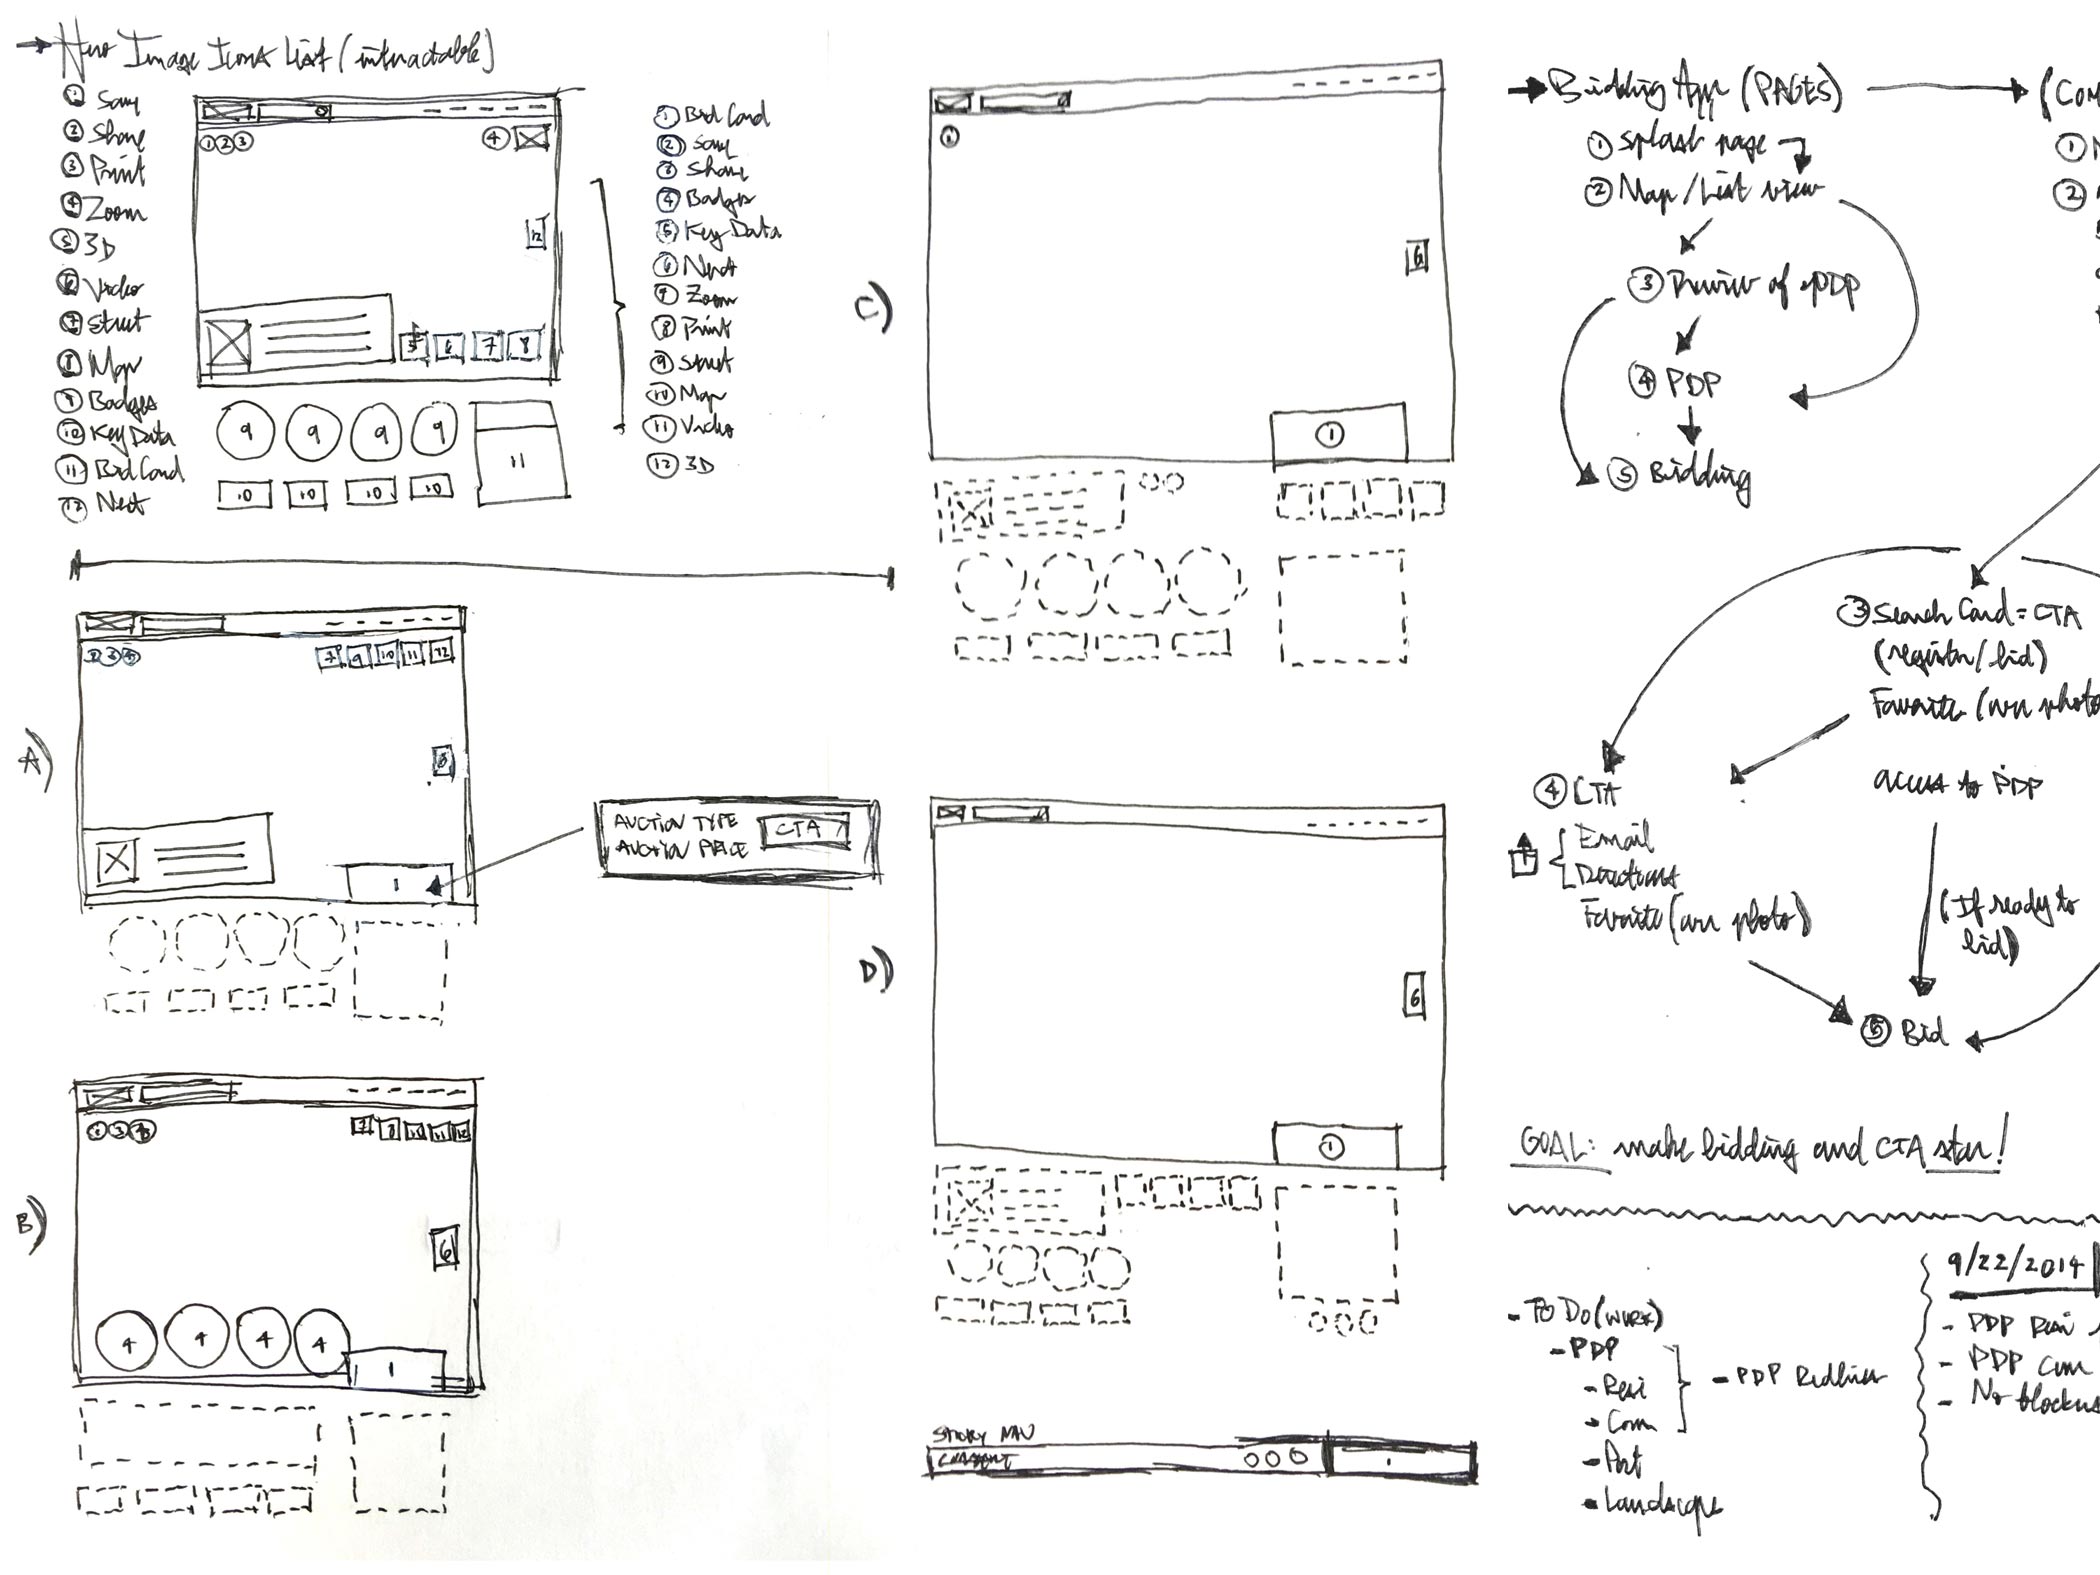
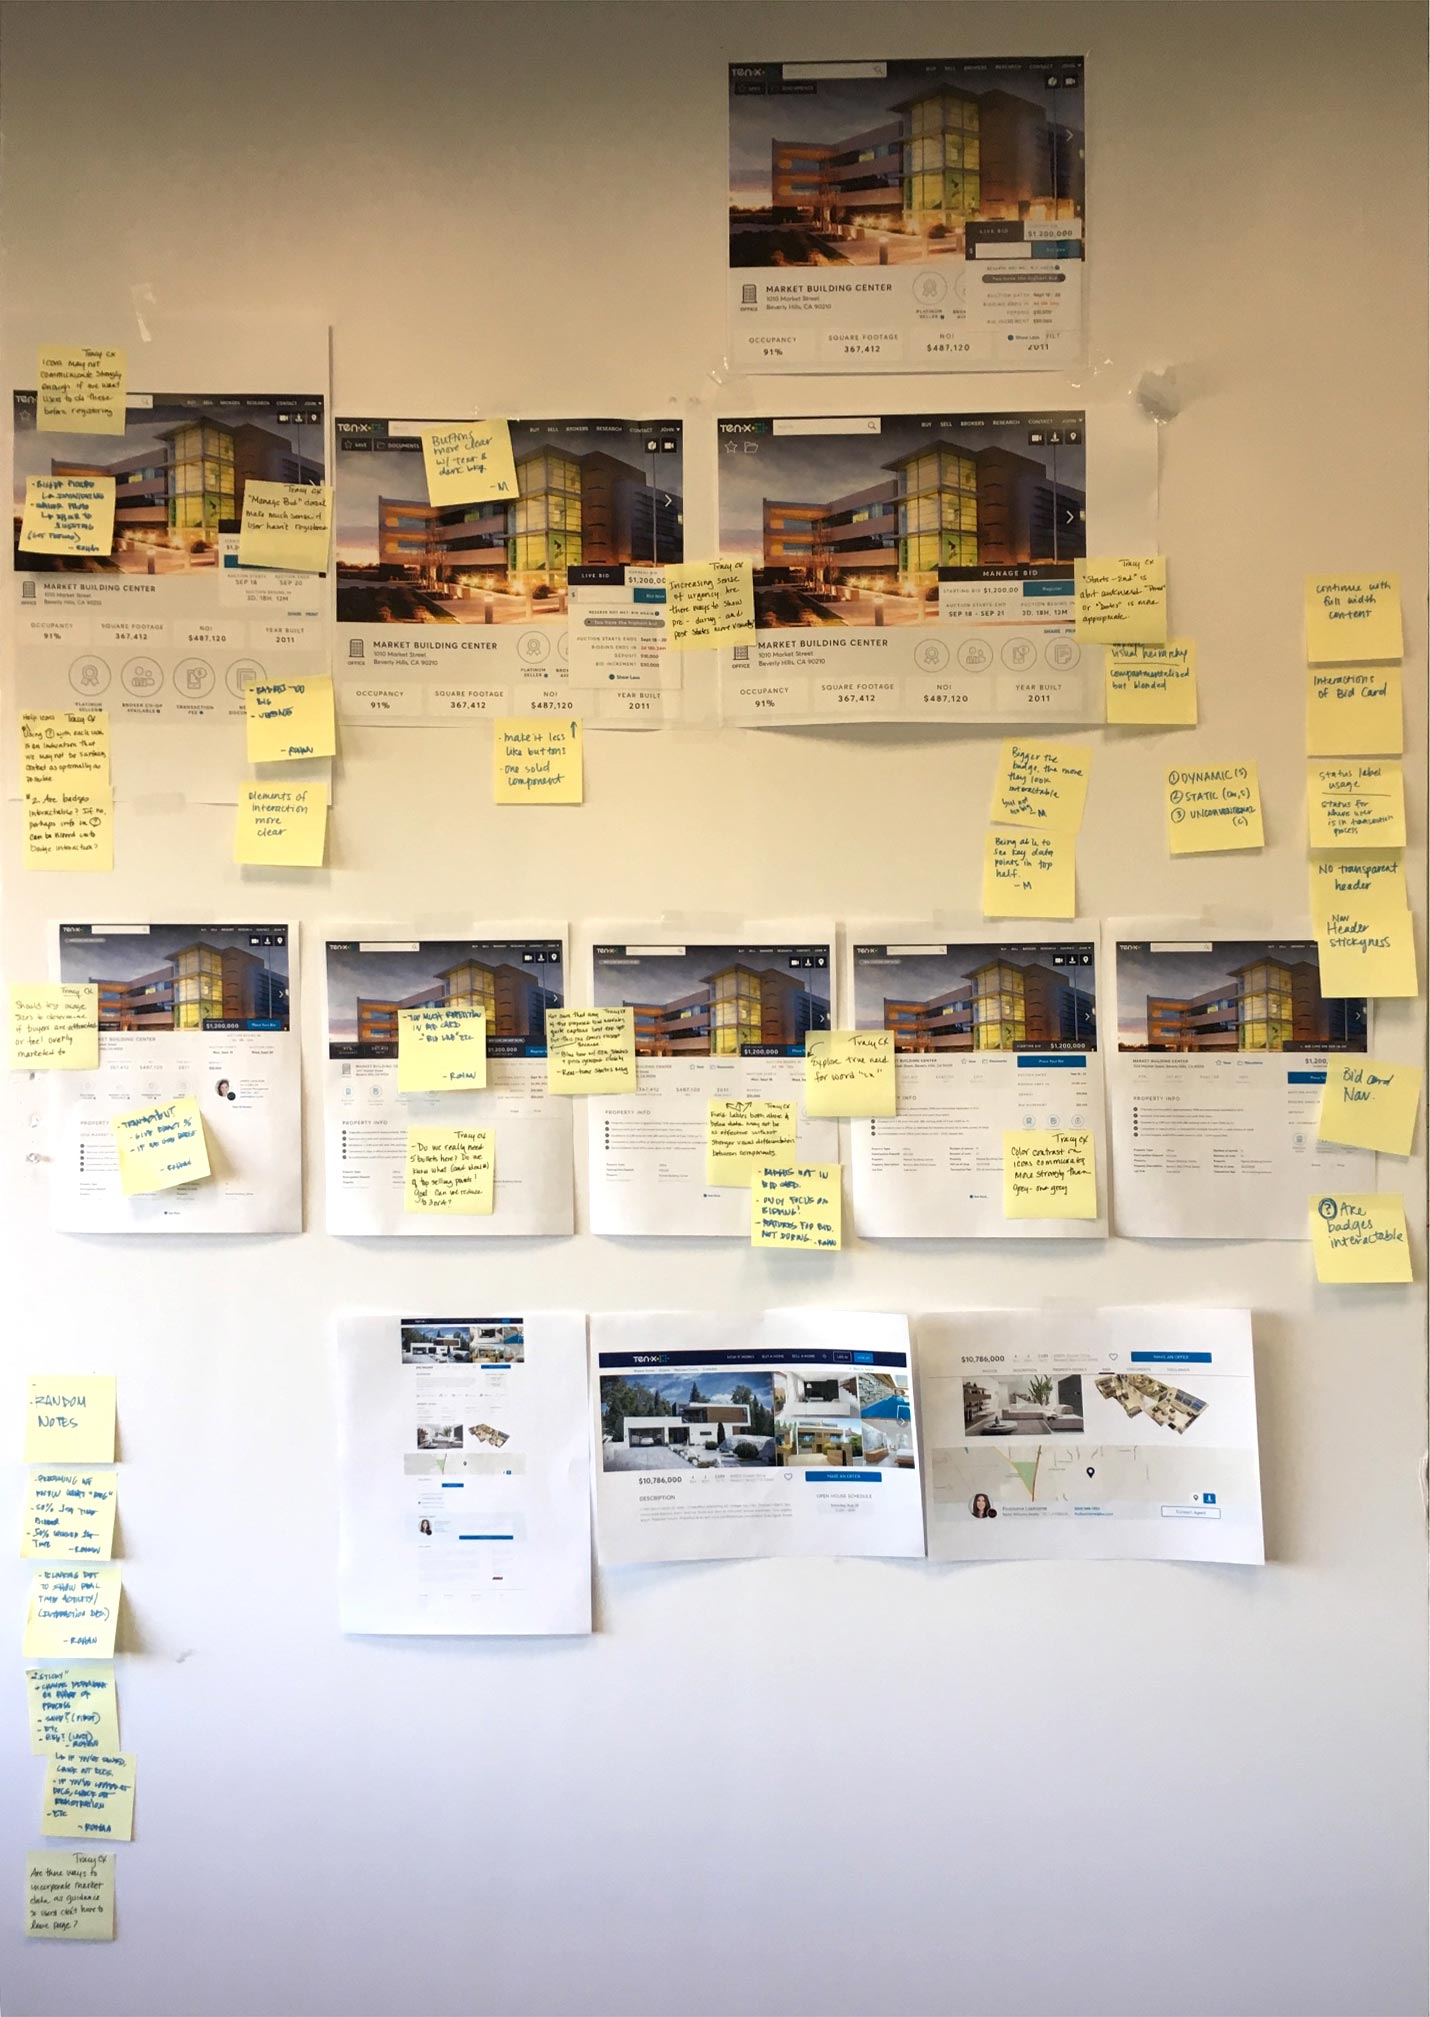
EXPLORE PHASE (Sketching)
I began ideations and sketching early UX, UI and IA explorations. The goal here is to prioritize information & content.
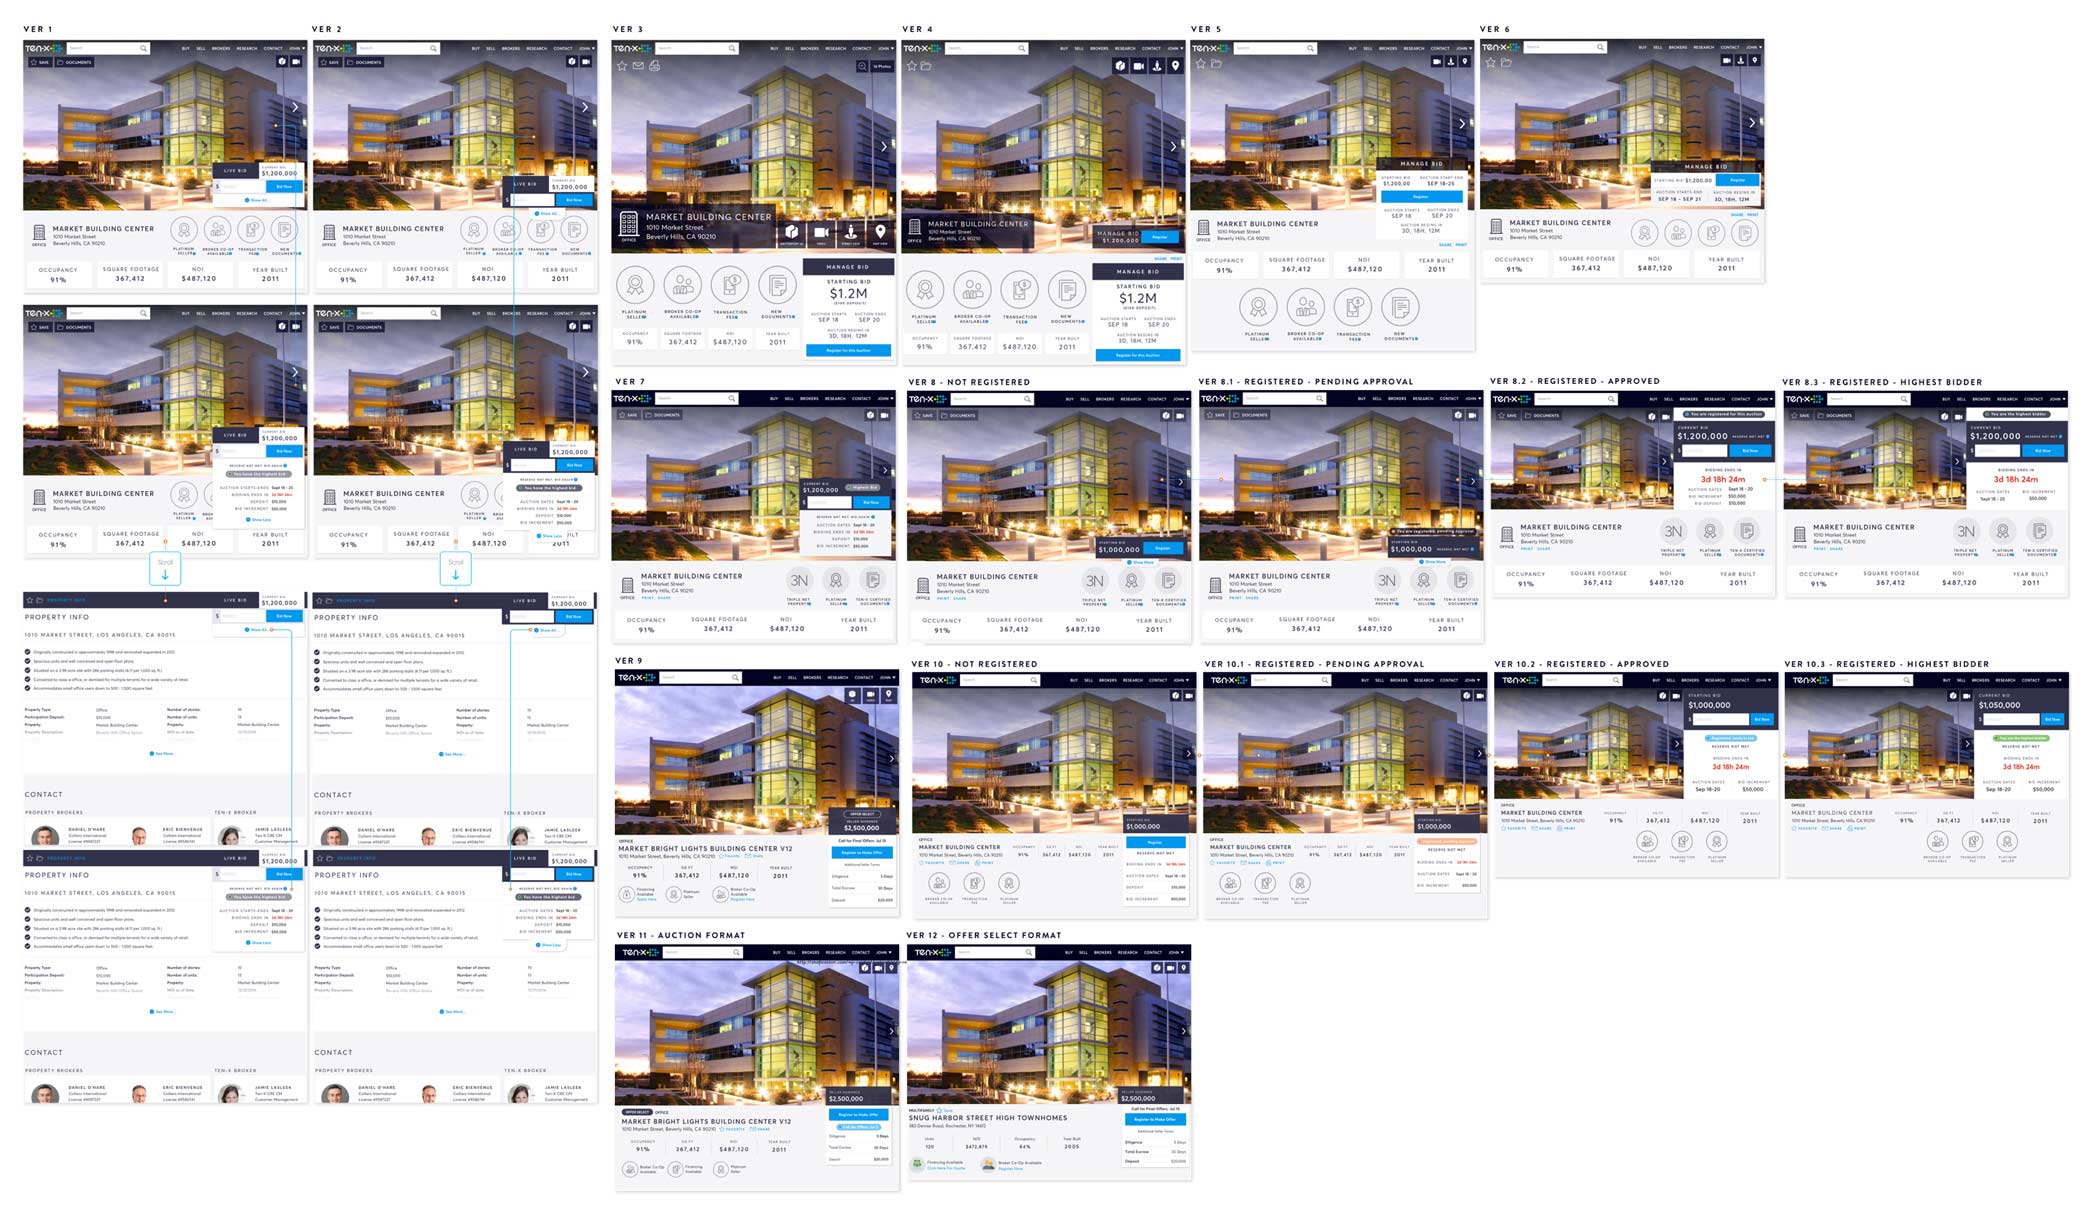
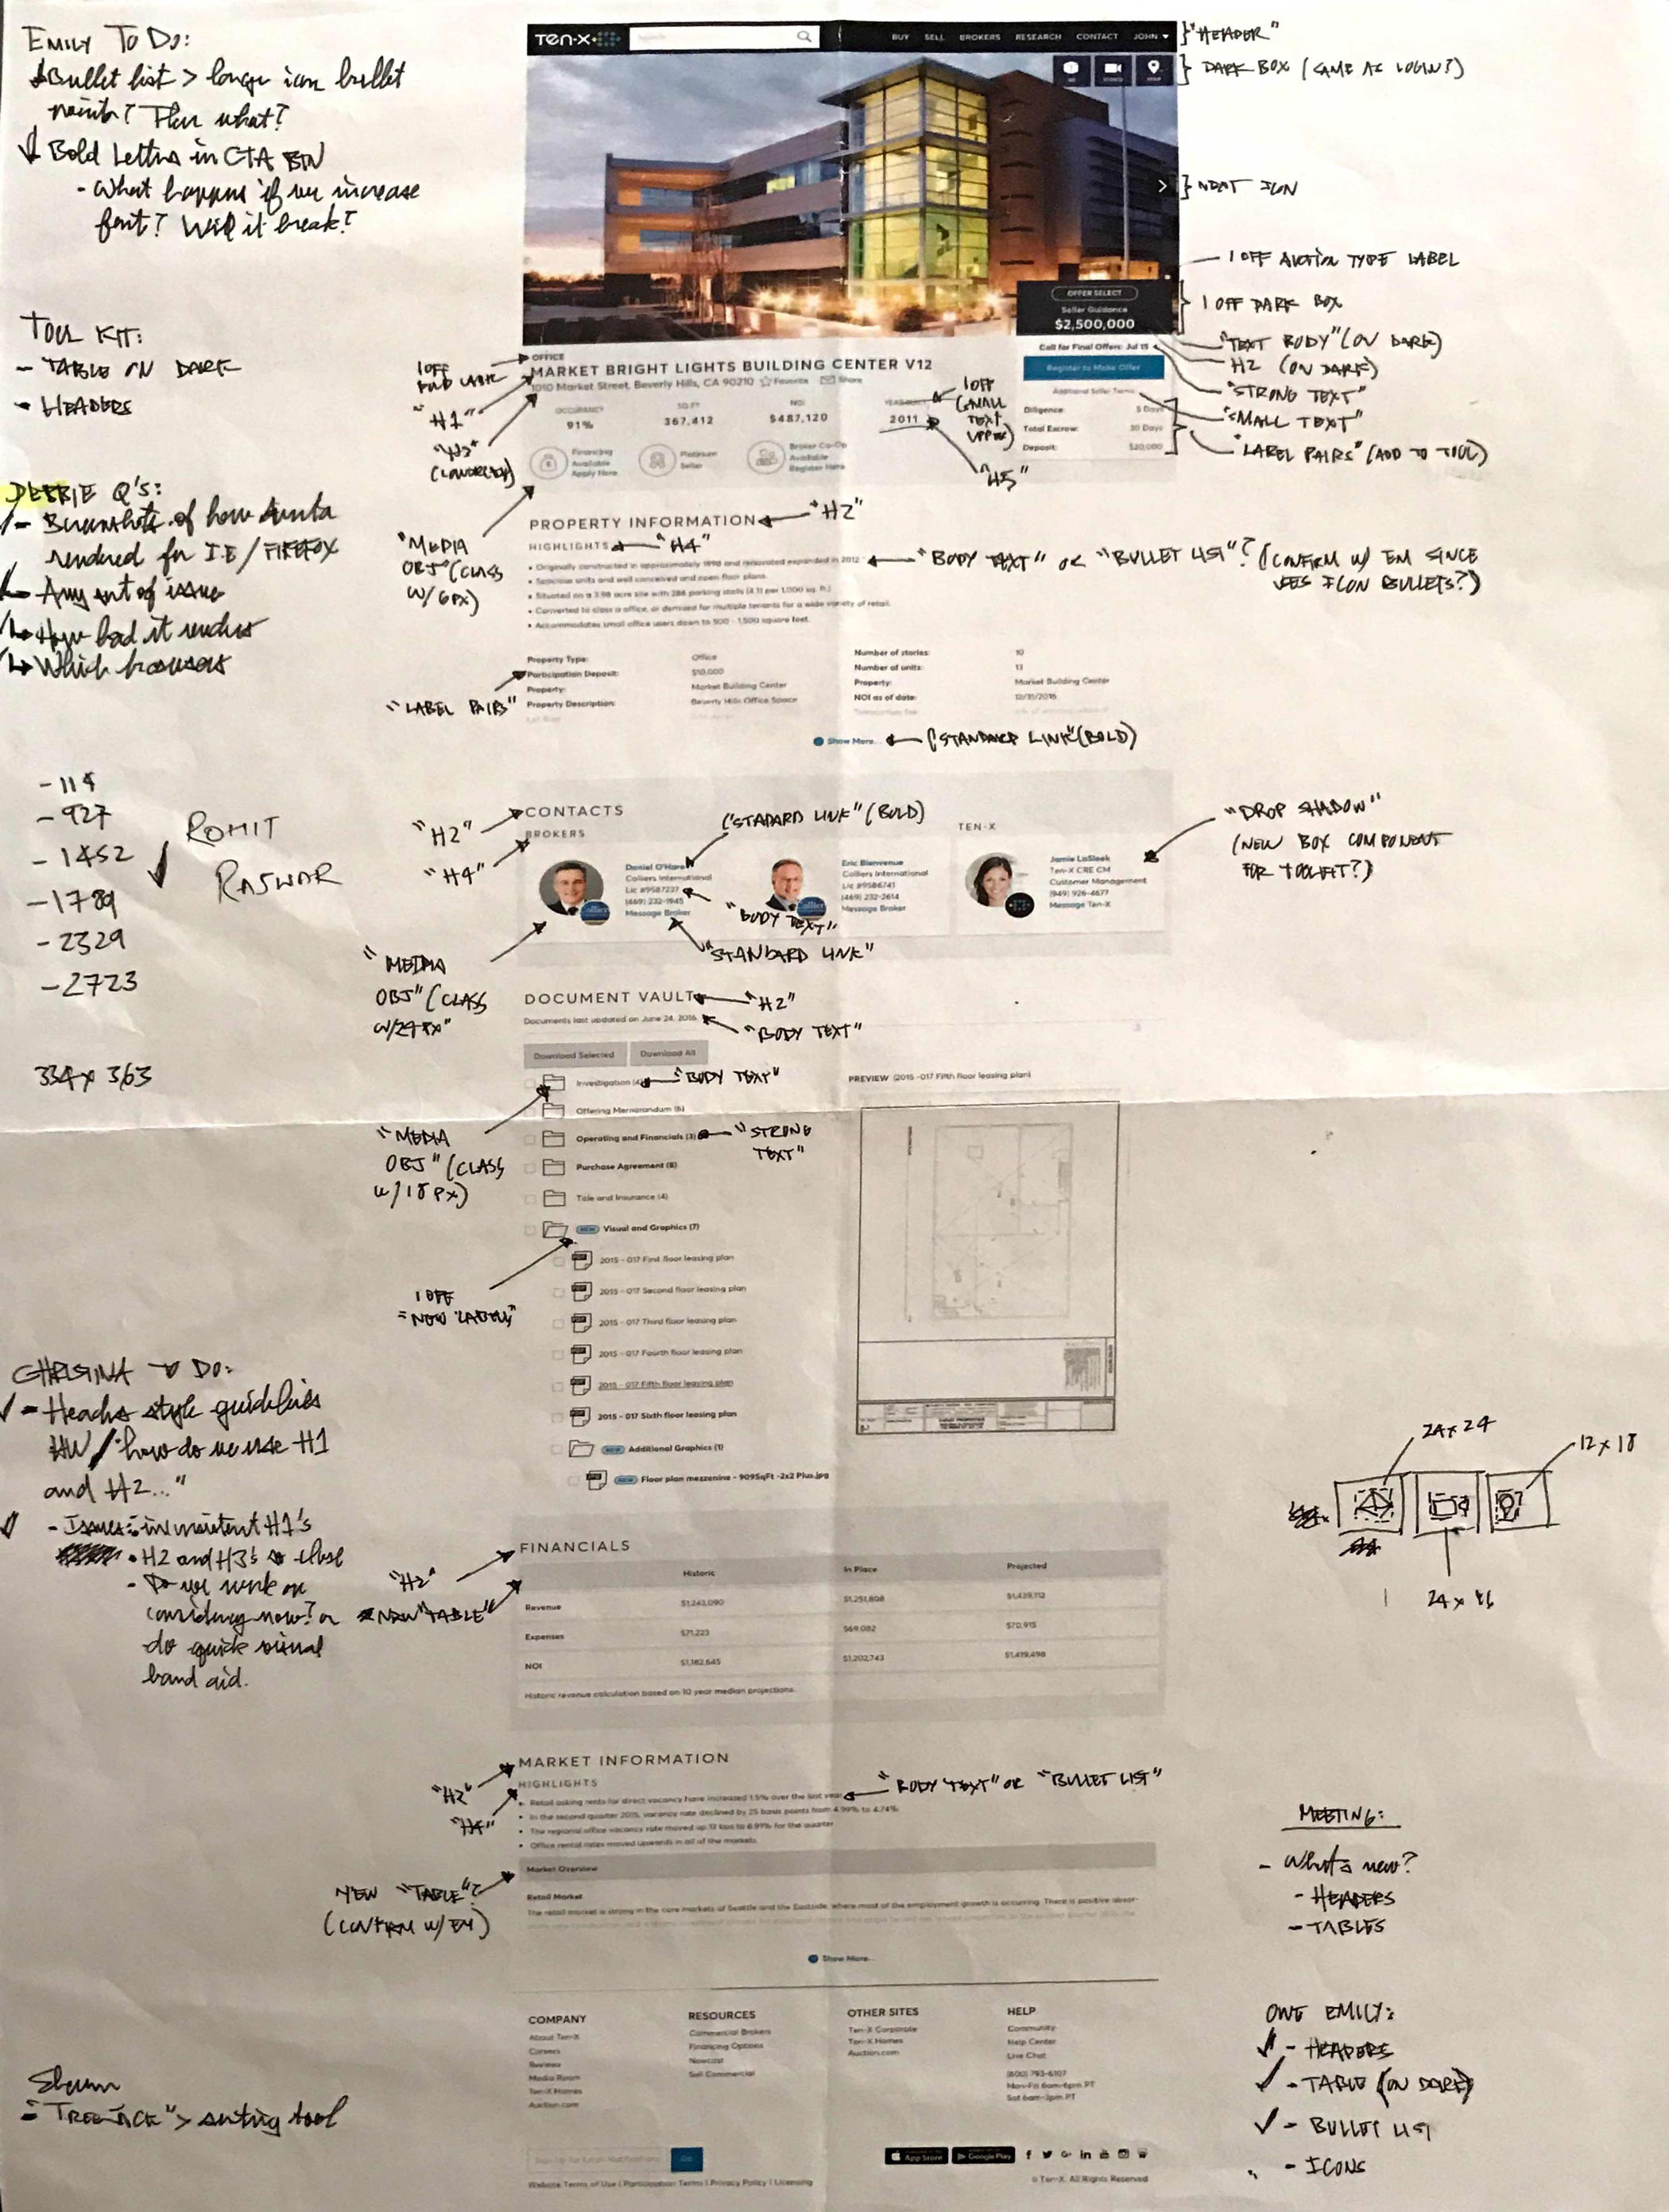
EXPLORE PHASE (Wireframes)
I created wireframes capturing the current experience first. Then using the research, data and user feedback from the understand phase, I created multiple UIs to determine information hierarchy.
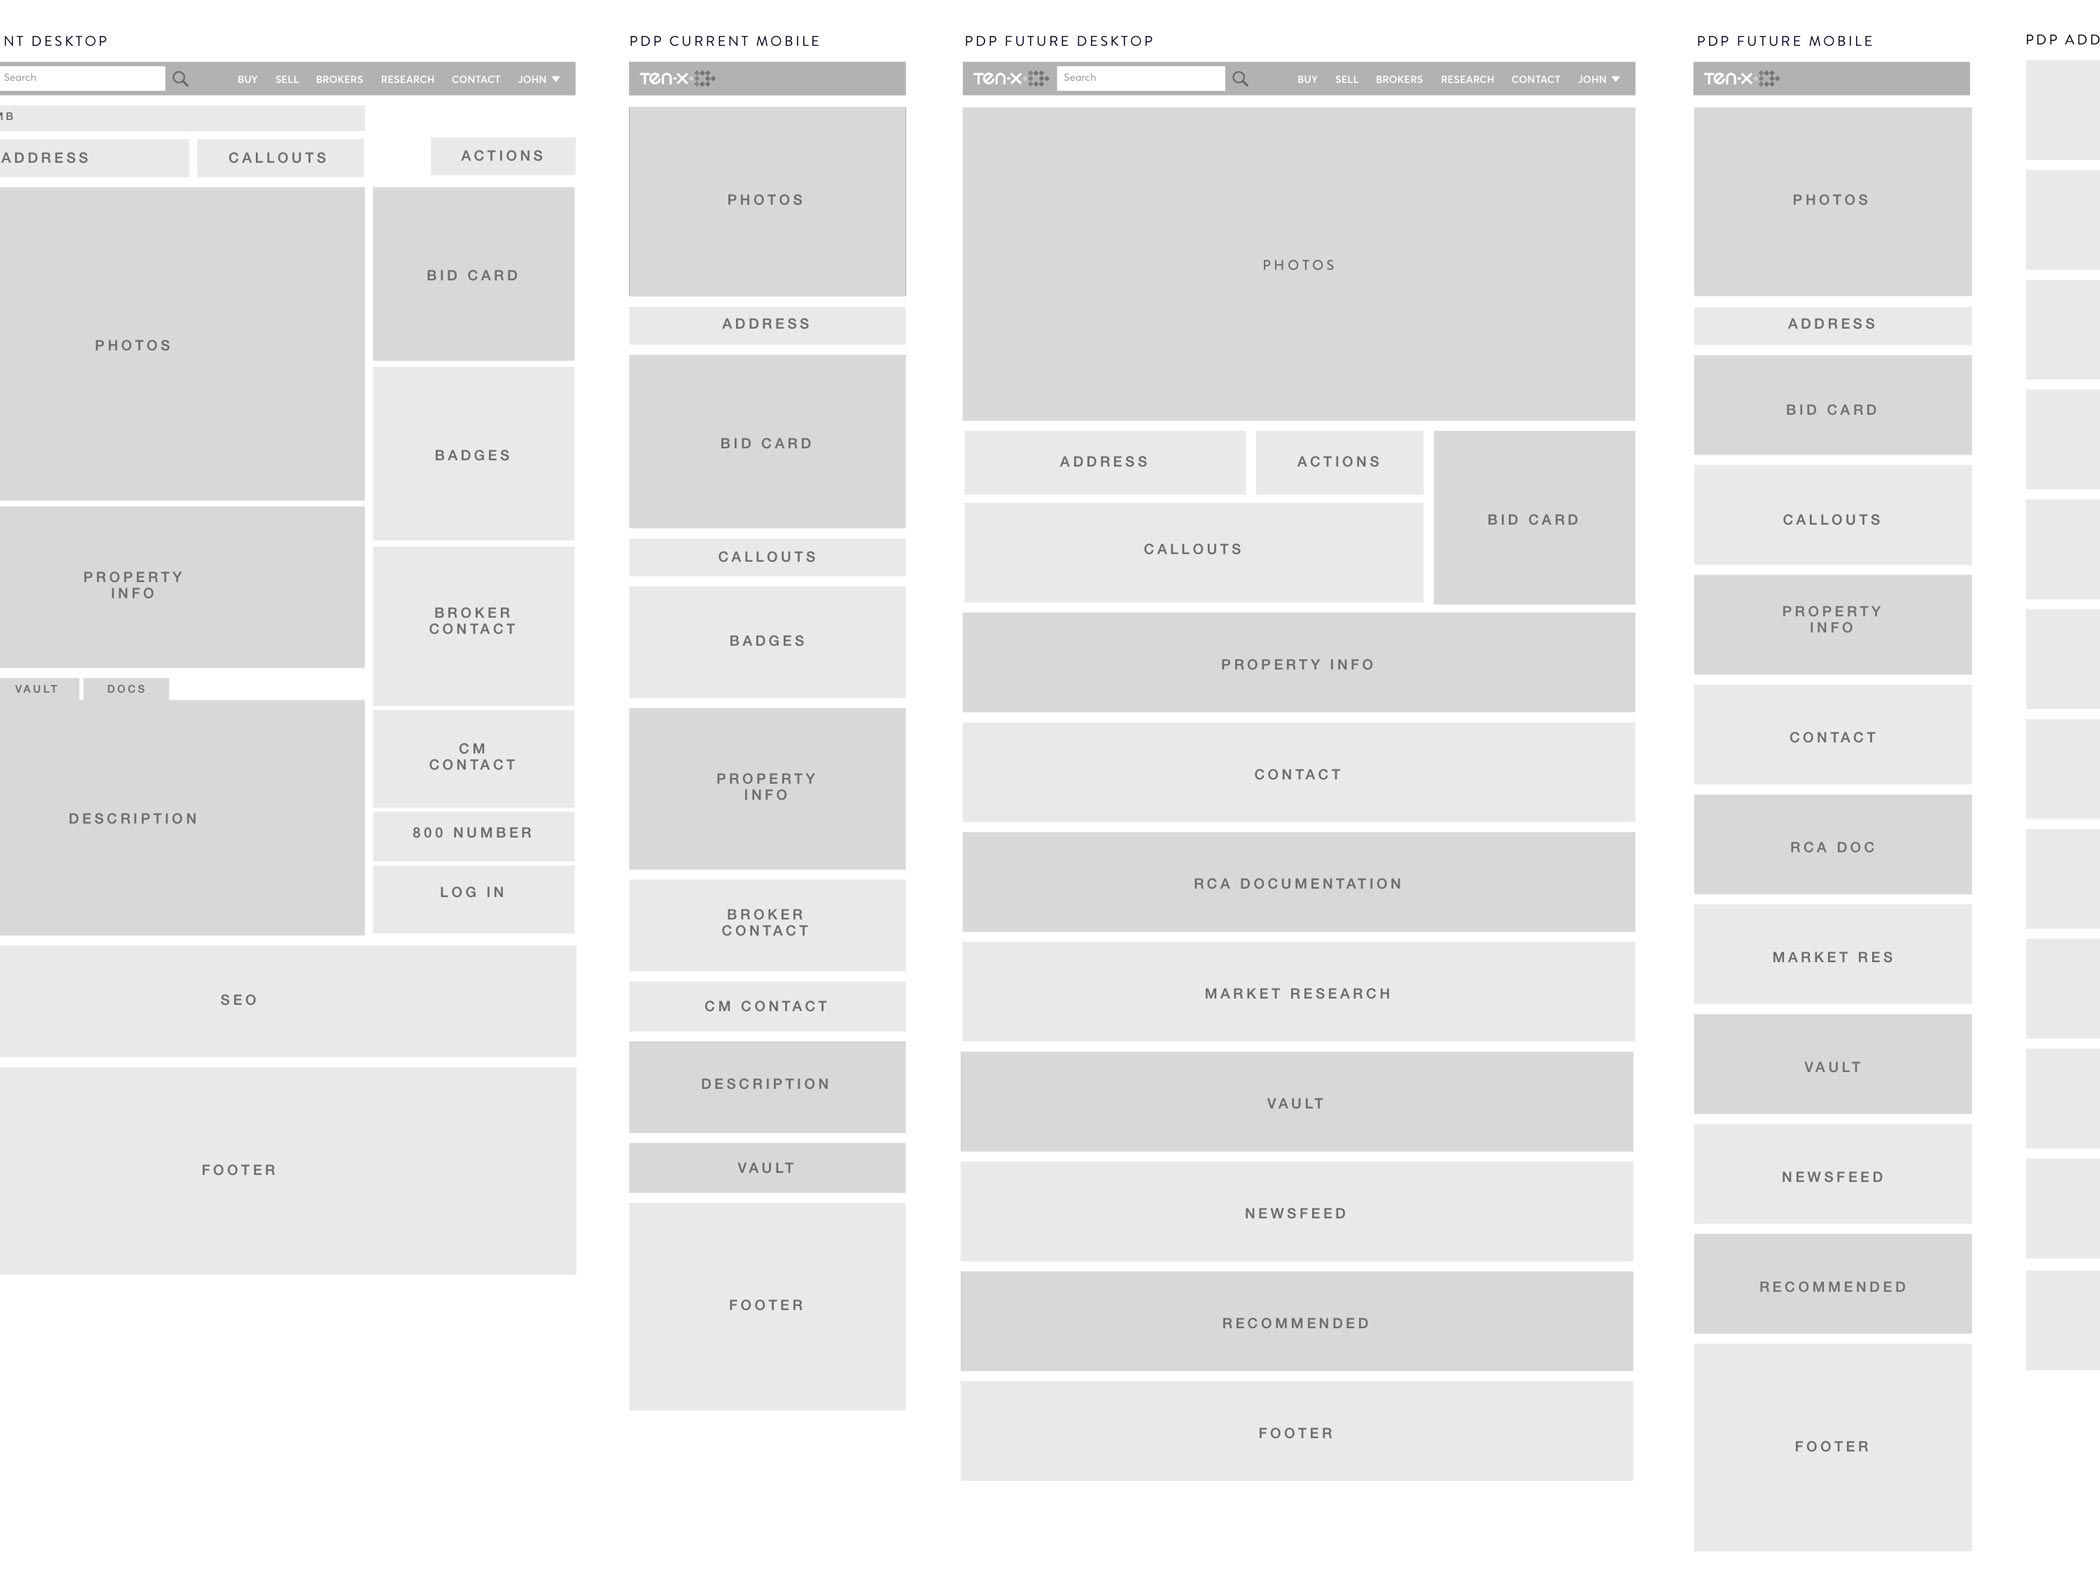
EXPLORE PHASE (Wireframe Transitions)
I transitioned detailed wireframes to high fidelity visual design concepts. As wireframes help to determine information hierarchy, high fidelity helps to determine visual hierarchy.
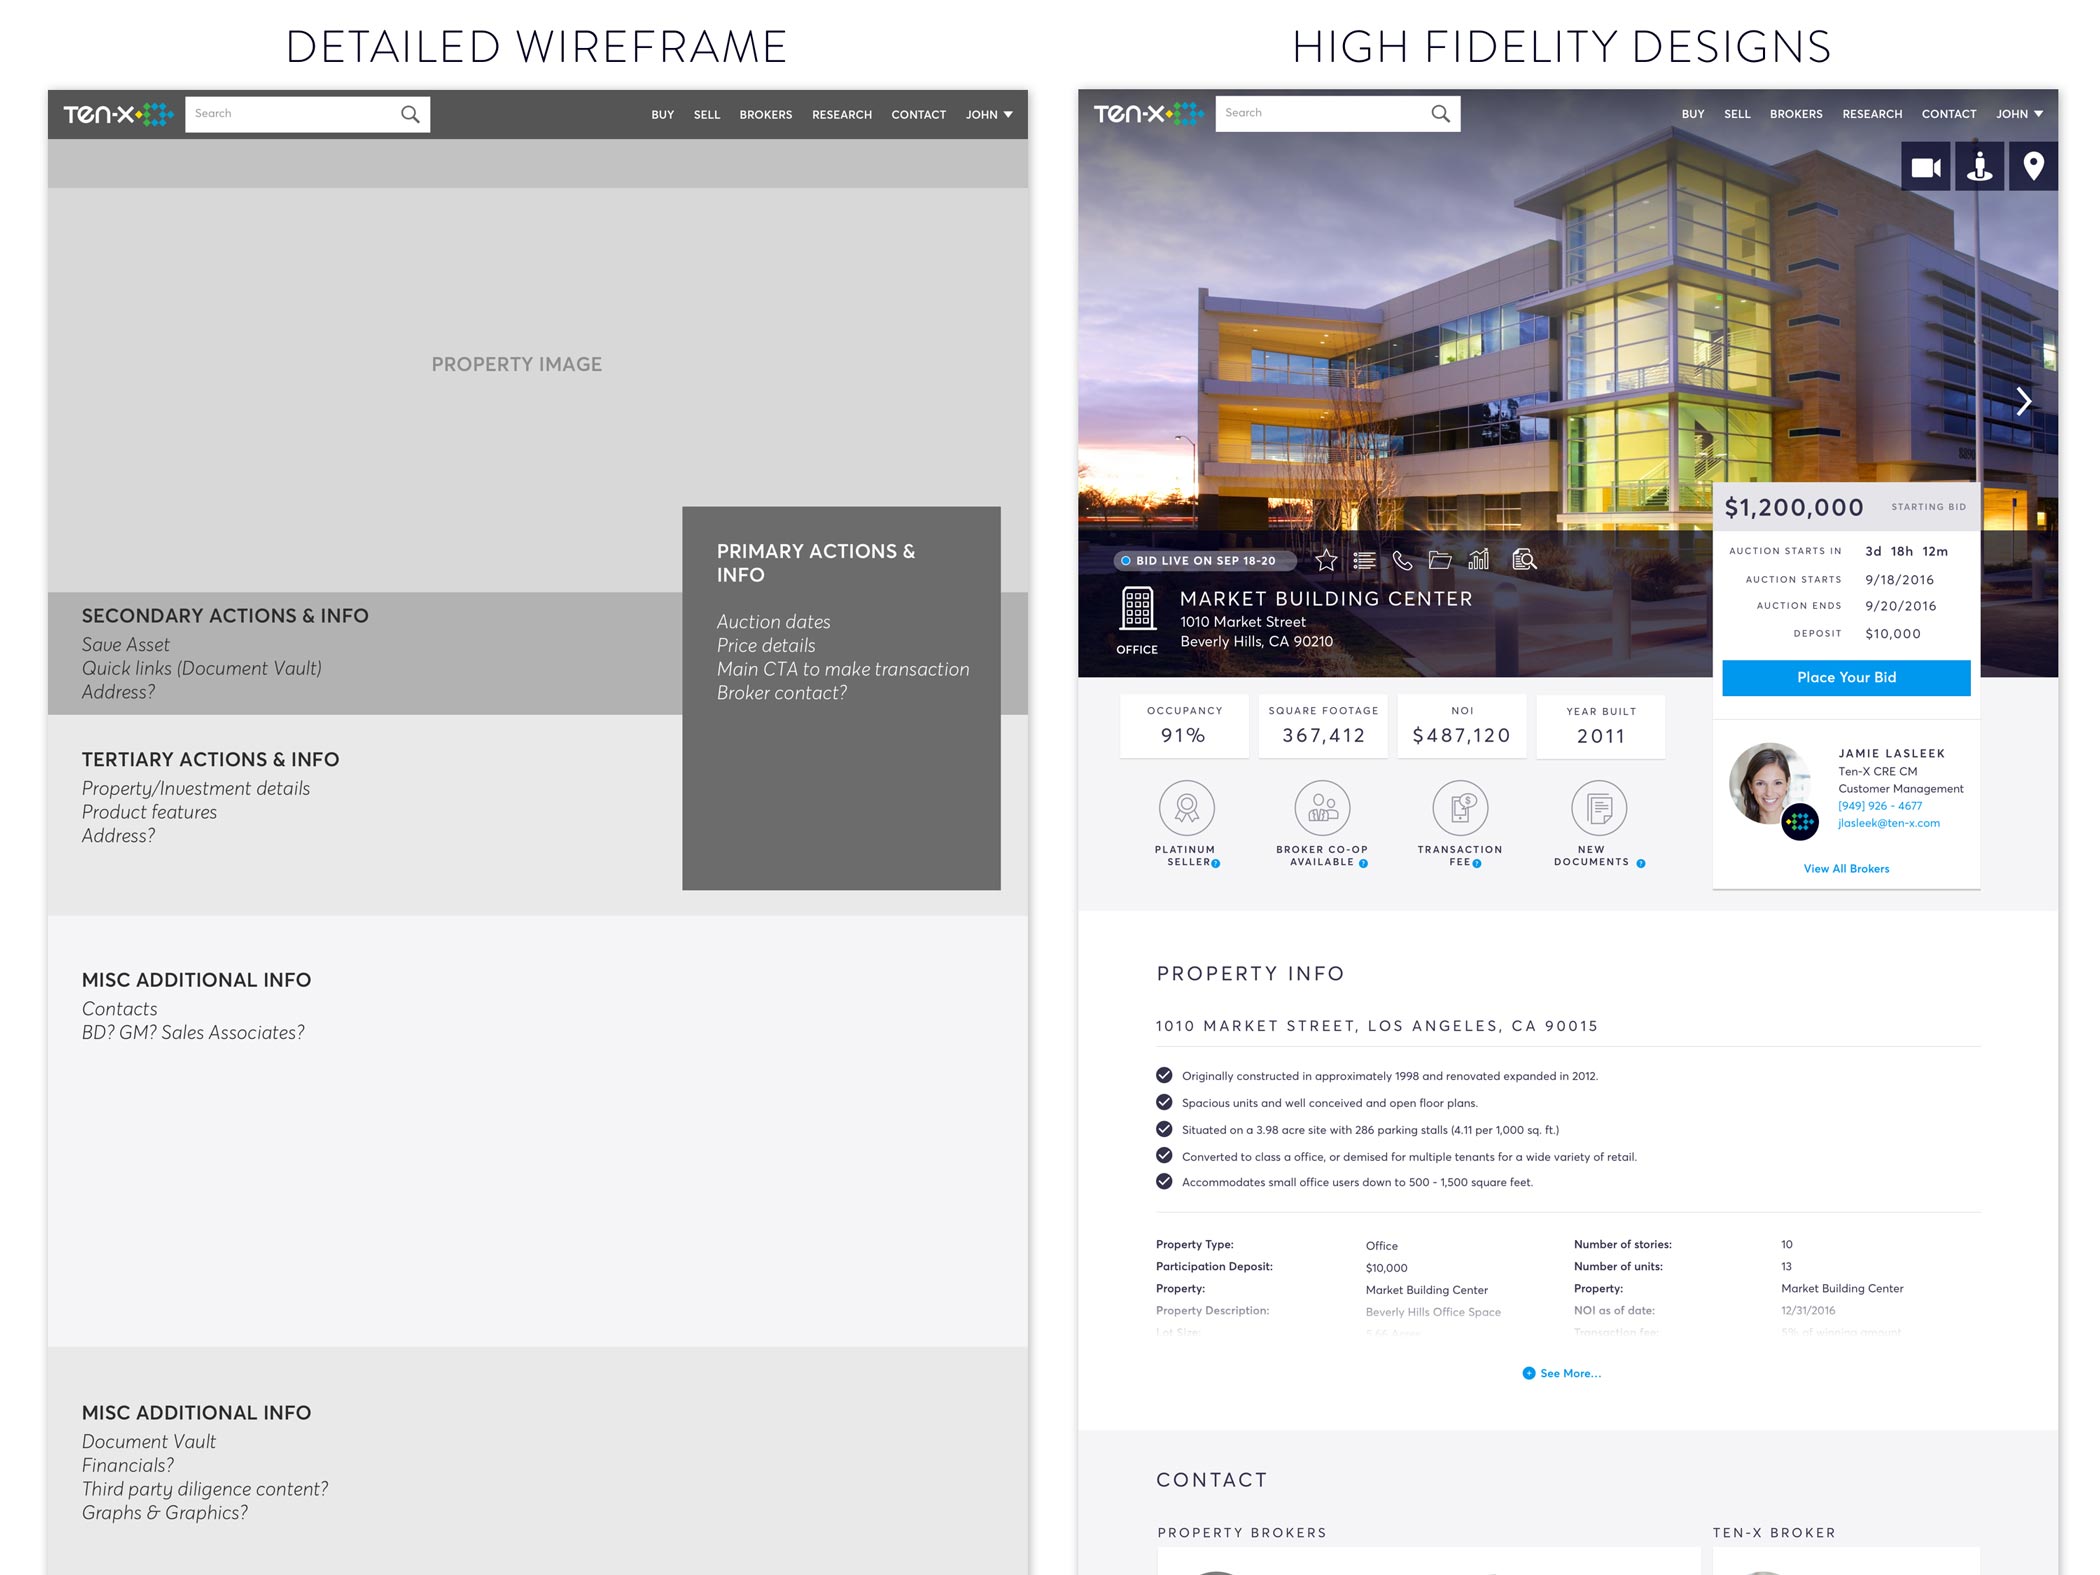
EXPLORE PHASE (High Fidelity Designs)
I created a large variety of high fidelity UI designs for feedback and revisions. This gets into the weeds of visual design and help refine visual treatments such as eye tracking, typography, negative space, types, colors, page layout, etc.
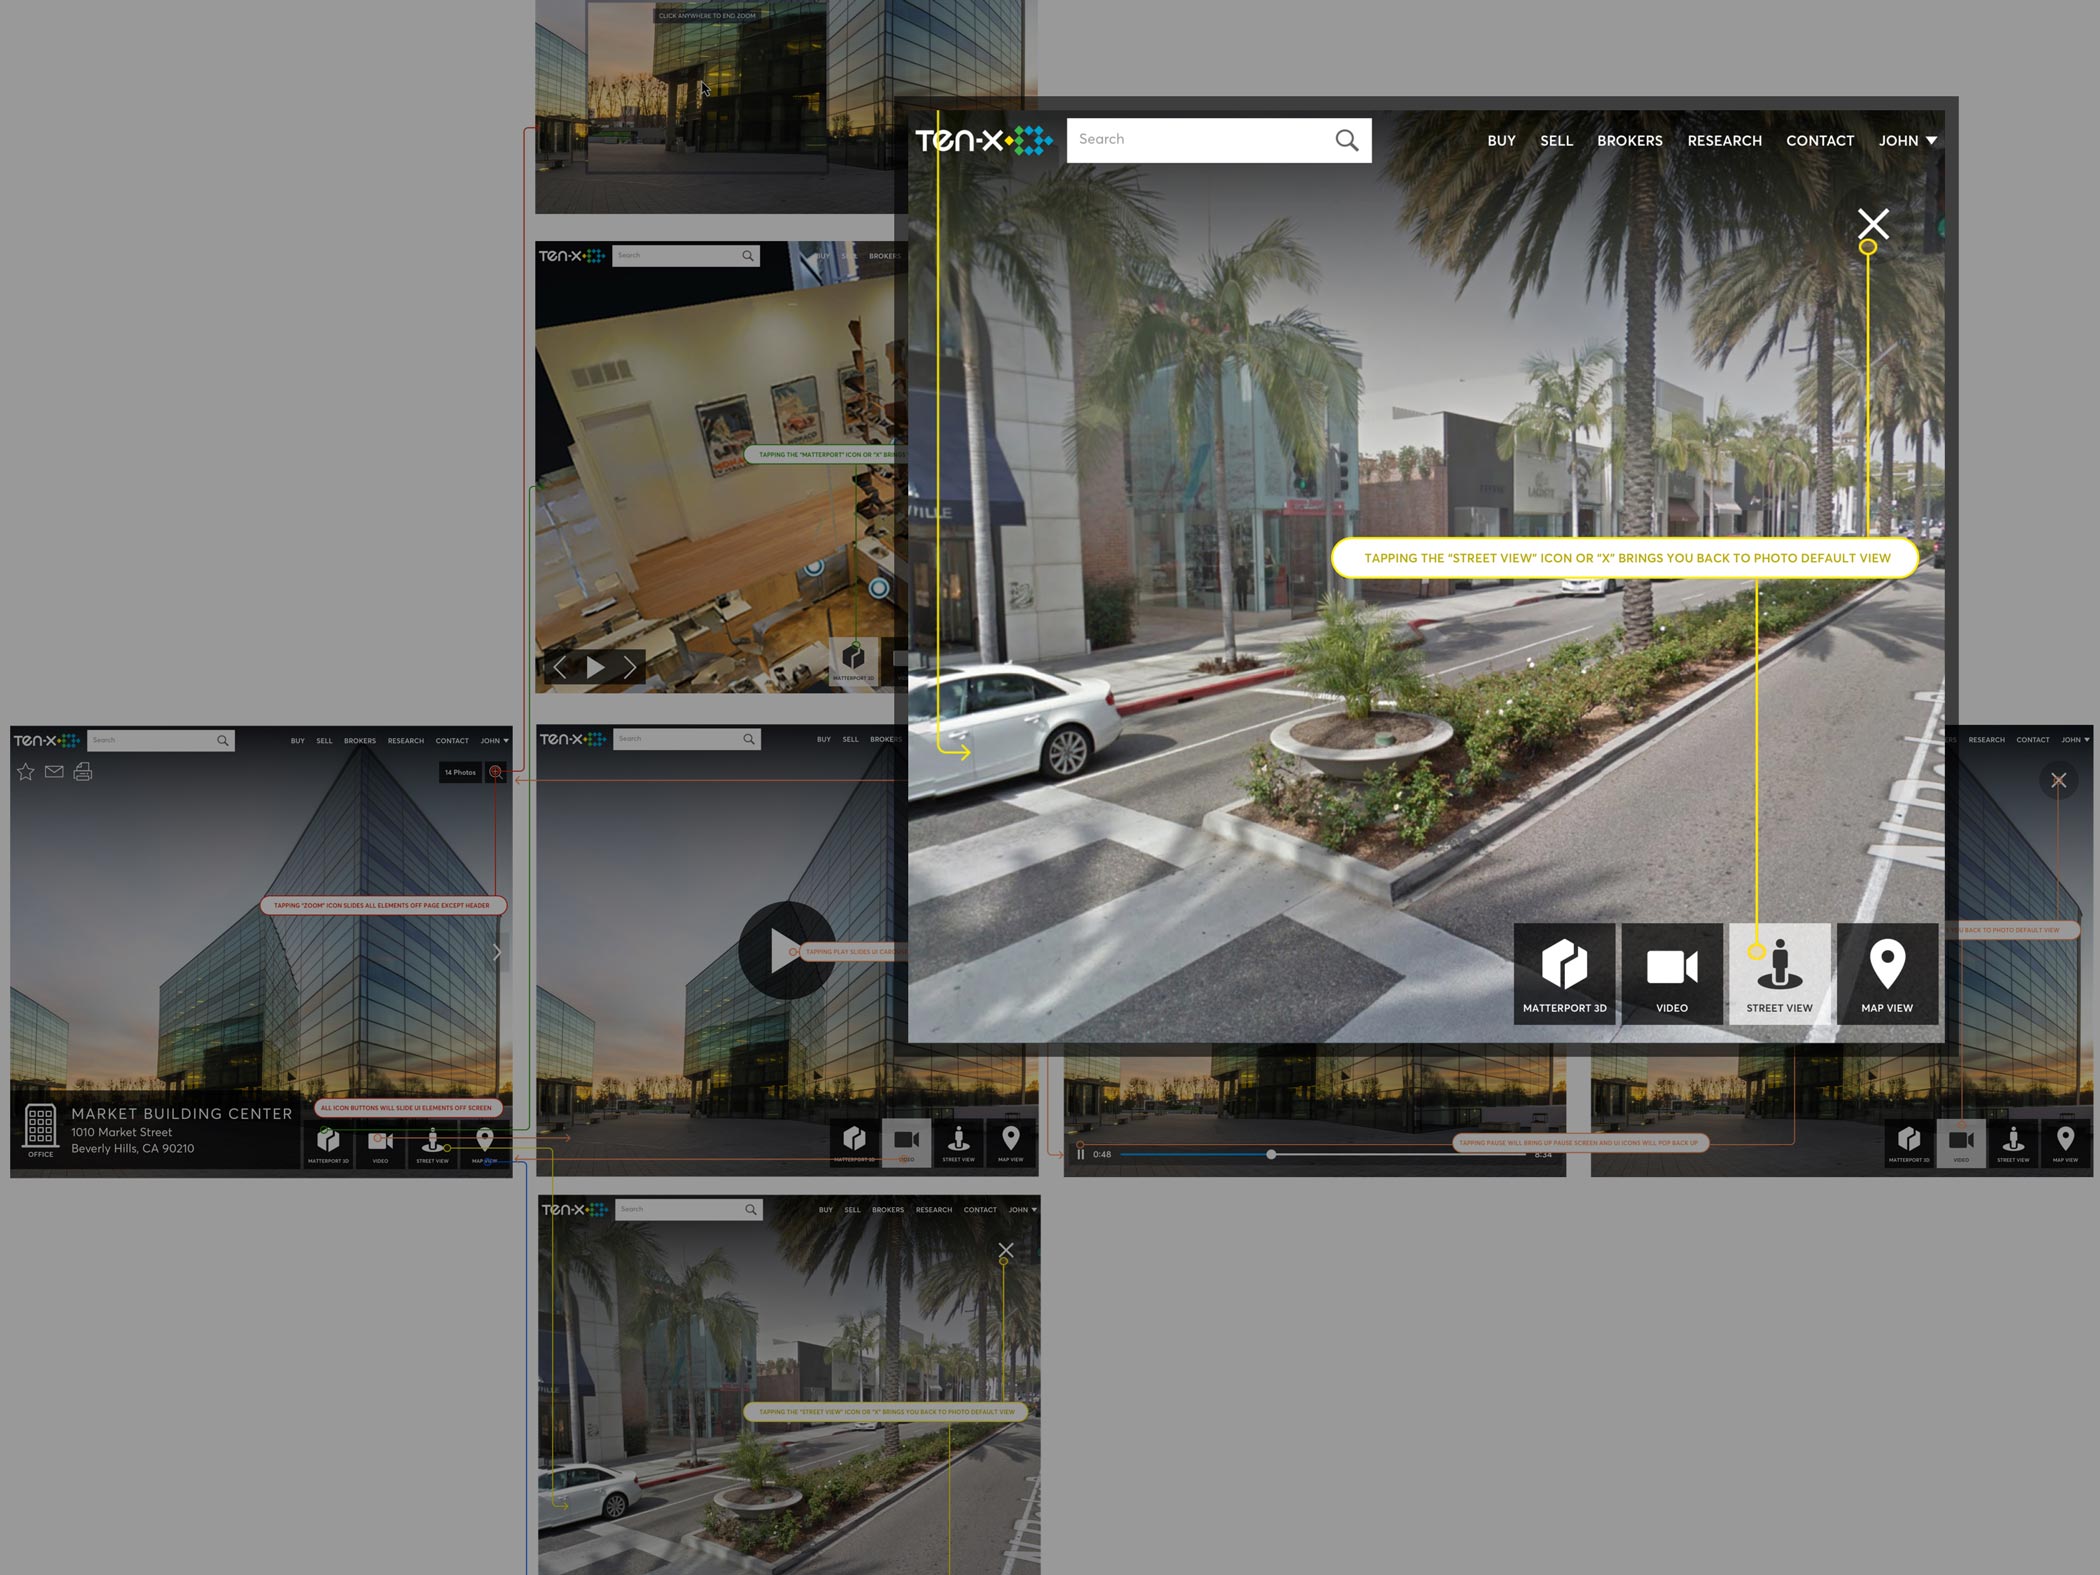
EXPLORE PHASE (Interaction Design)
I created early interaction design flows to help communicate the vision to developers.
EXPLORE PHASE (Leveraging Data)
I used data and metrics as leverage to counter stakeholder opinions through visual communication.
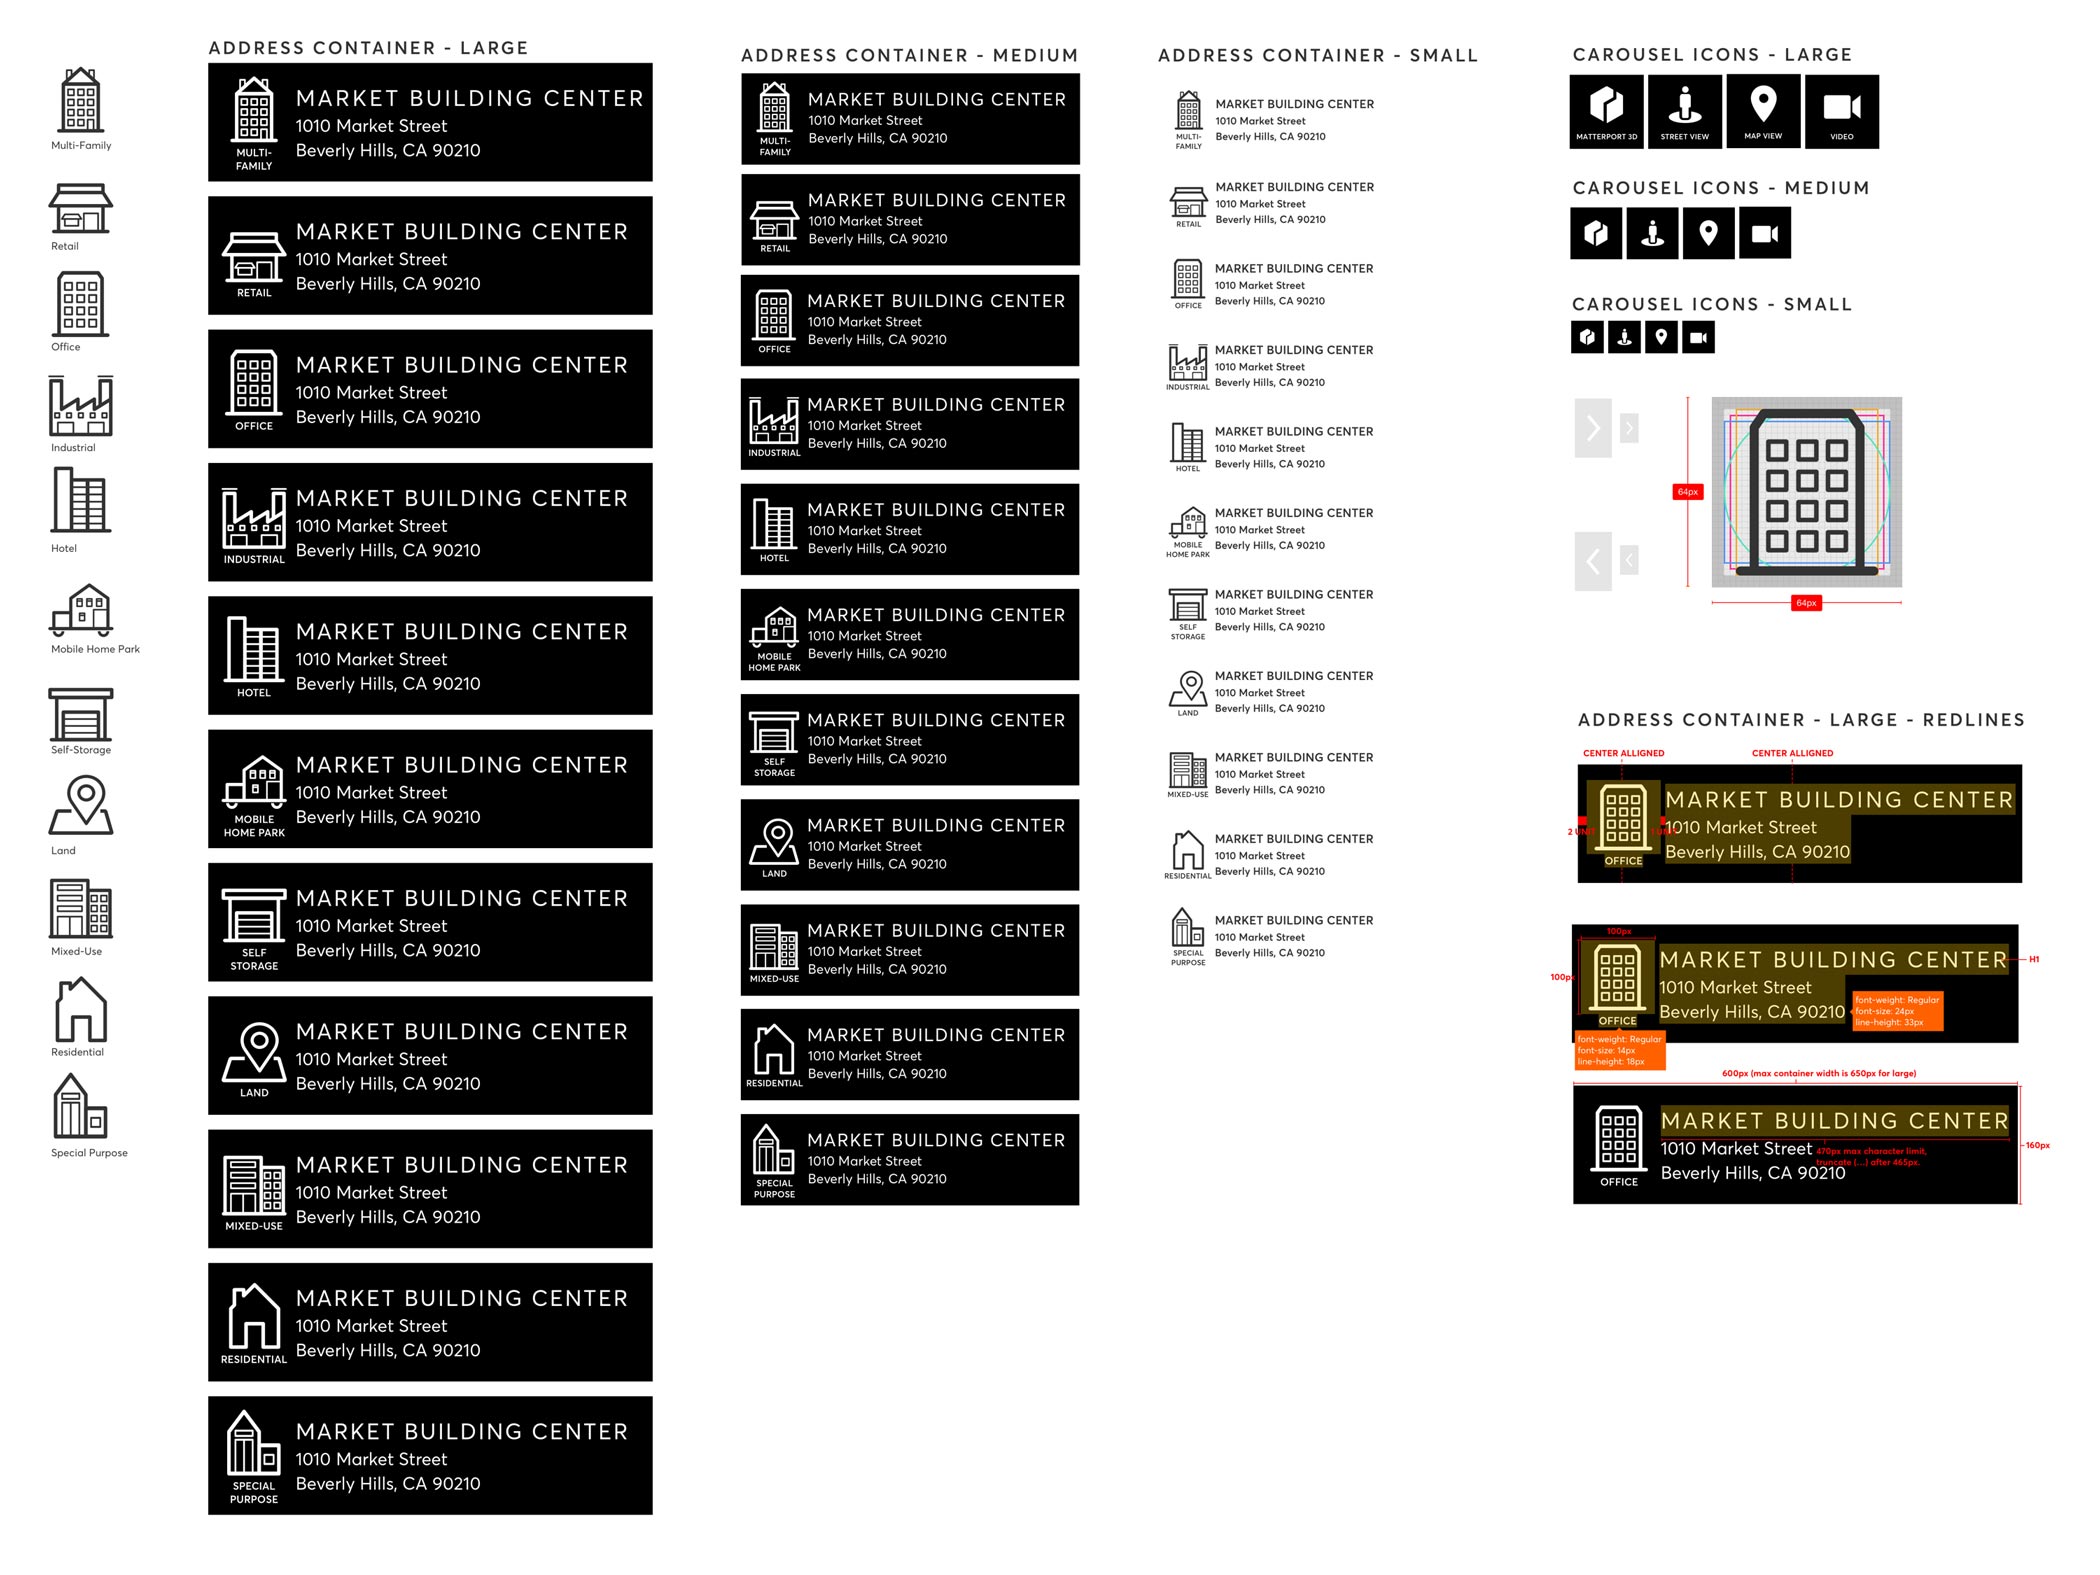
EXPLORE PHASE (Visual Design)
I concurrently was keeping a detailed visual design log to introduce iconography and visual concepts for the Styleguide & Toolkit. The process to add or introduce new components into the toolkit can be arduous.
EXPLORE PHASE (Feedback)
I gathered internal feedback with outside product team members, e.g. finance PM, content strategist, etc.
EXPLORE PHASE (Feedback)
I held a design bash with the PDP product team and gathered feedback and go through any outstanding questions, concerns or issues.
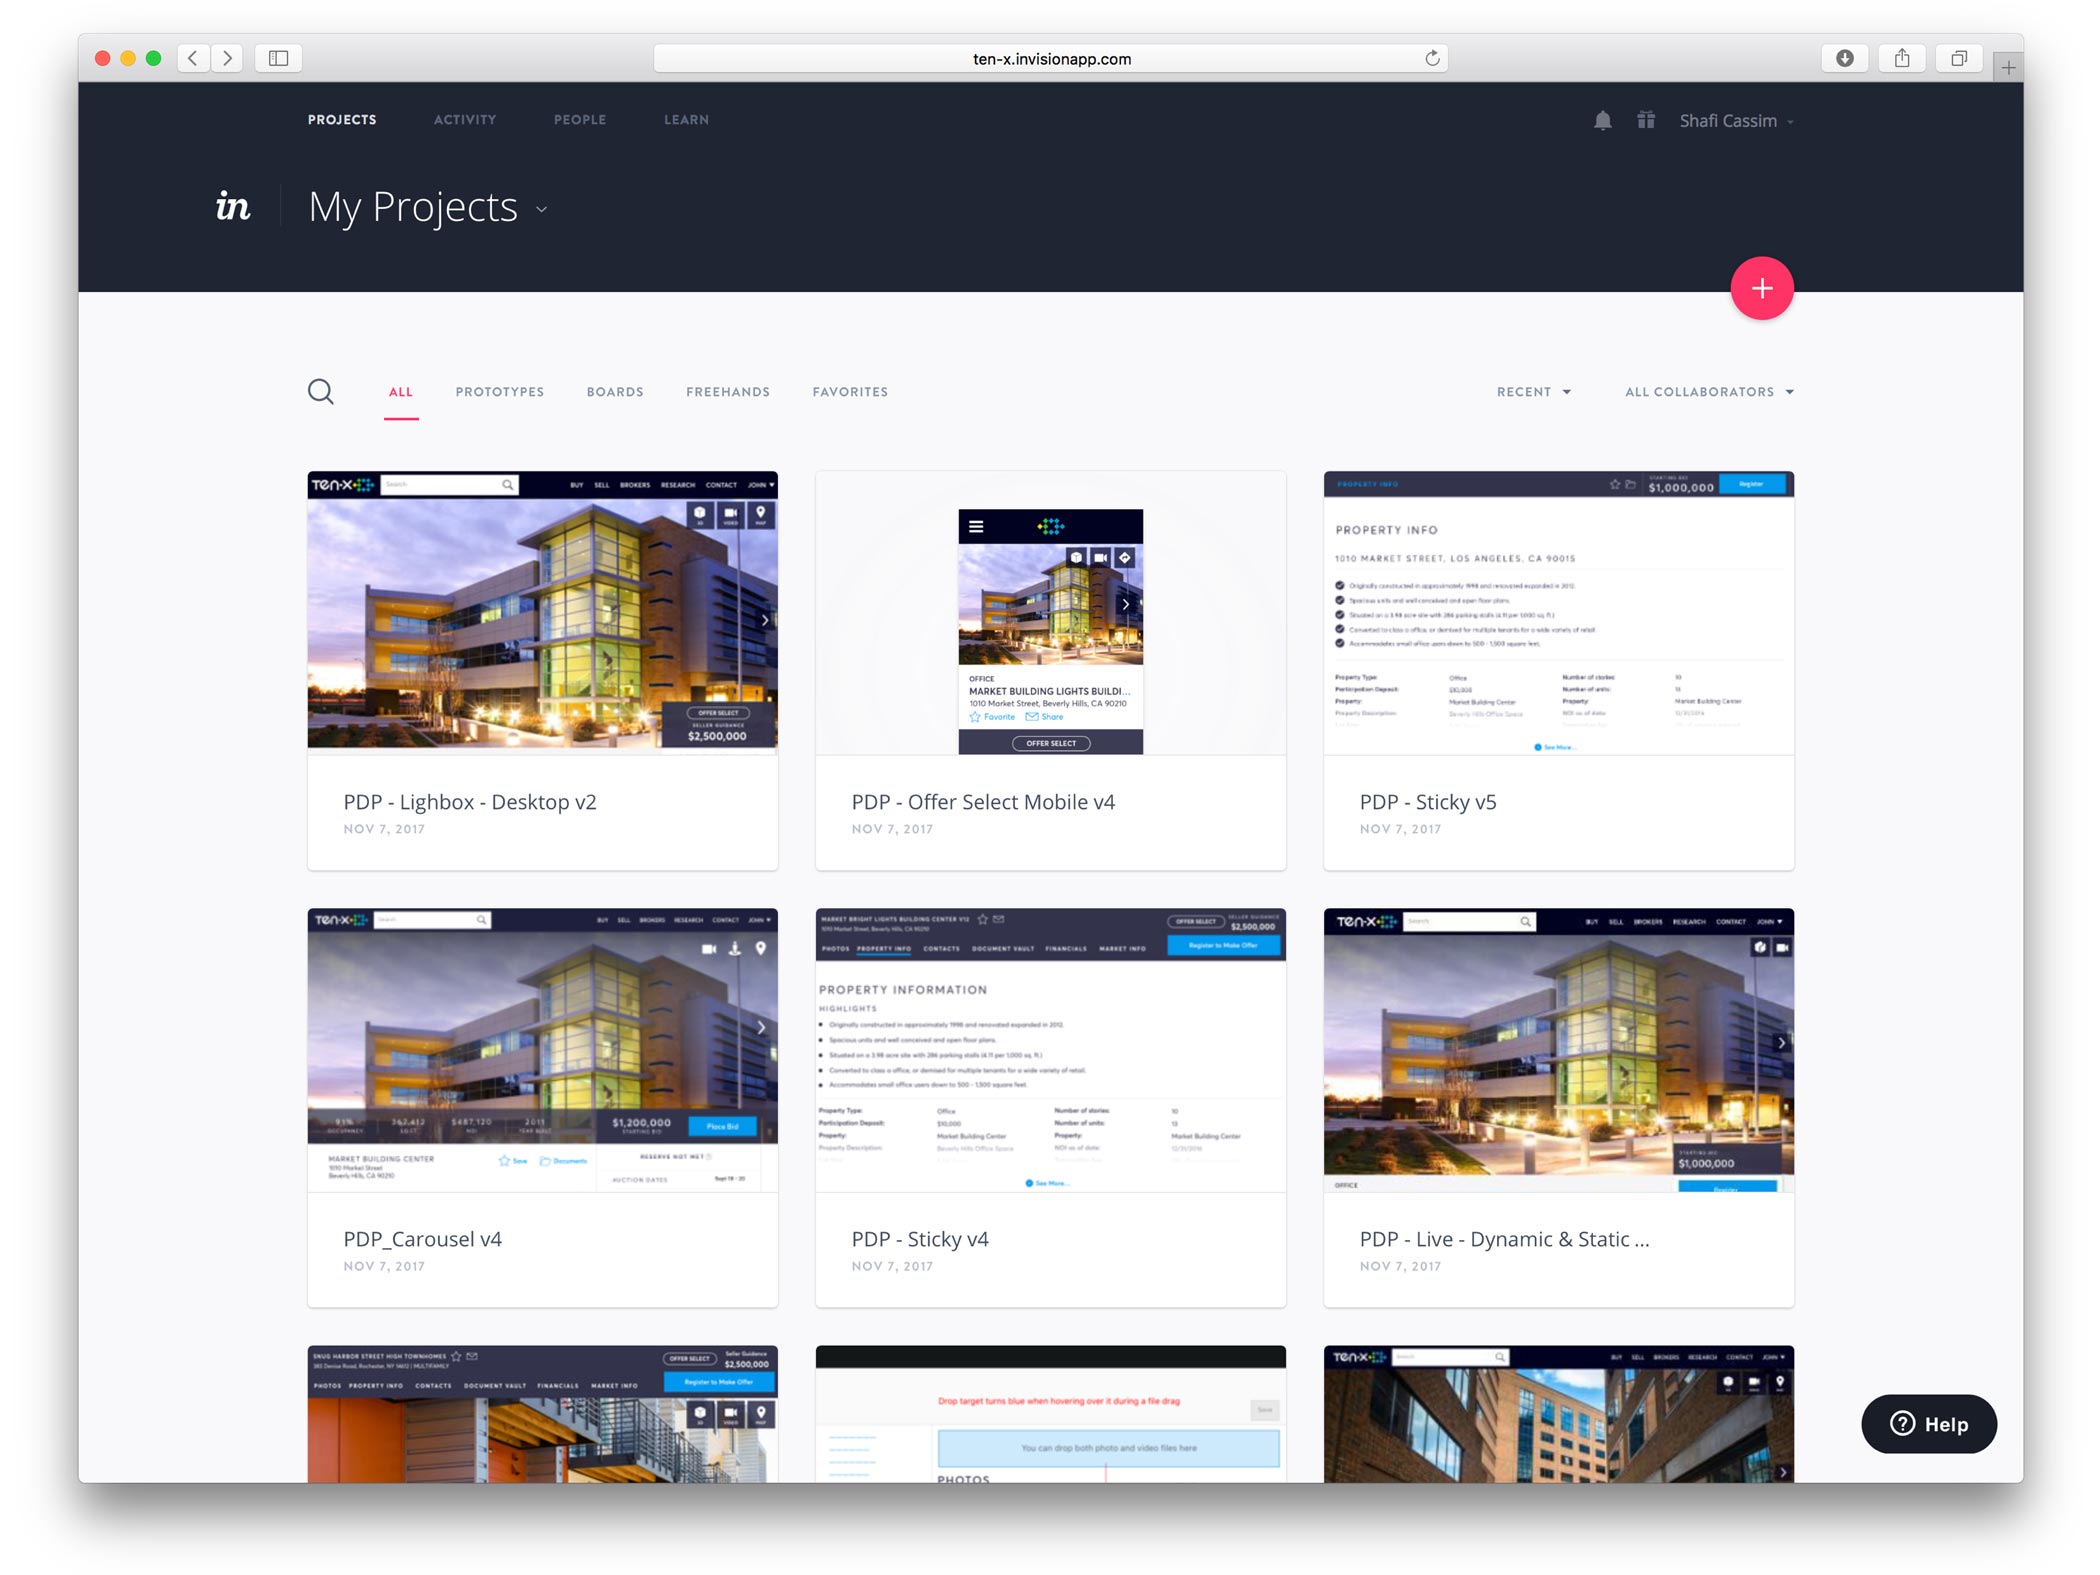
EXPLORE PHASE (Prototype)
I prototyped a full fledged app in inVision and tested my multiple designs internally with various stakeholders for feedback & revisions.
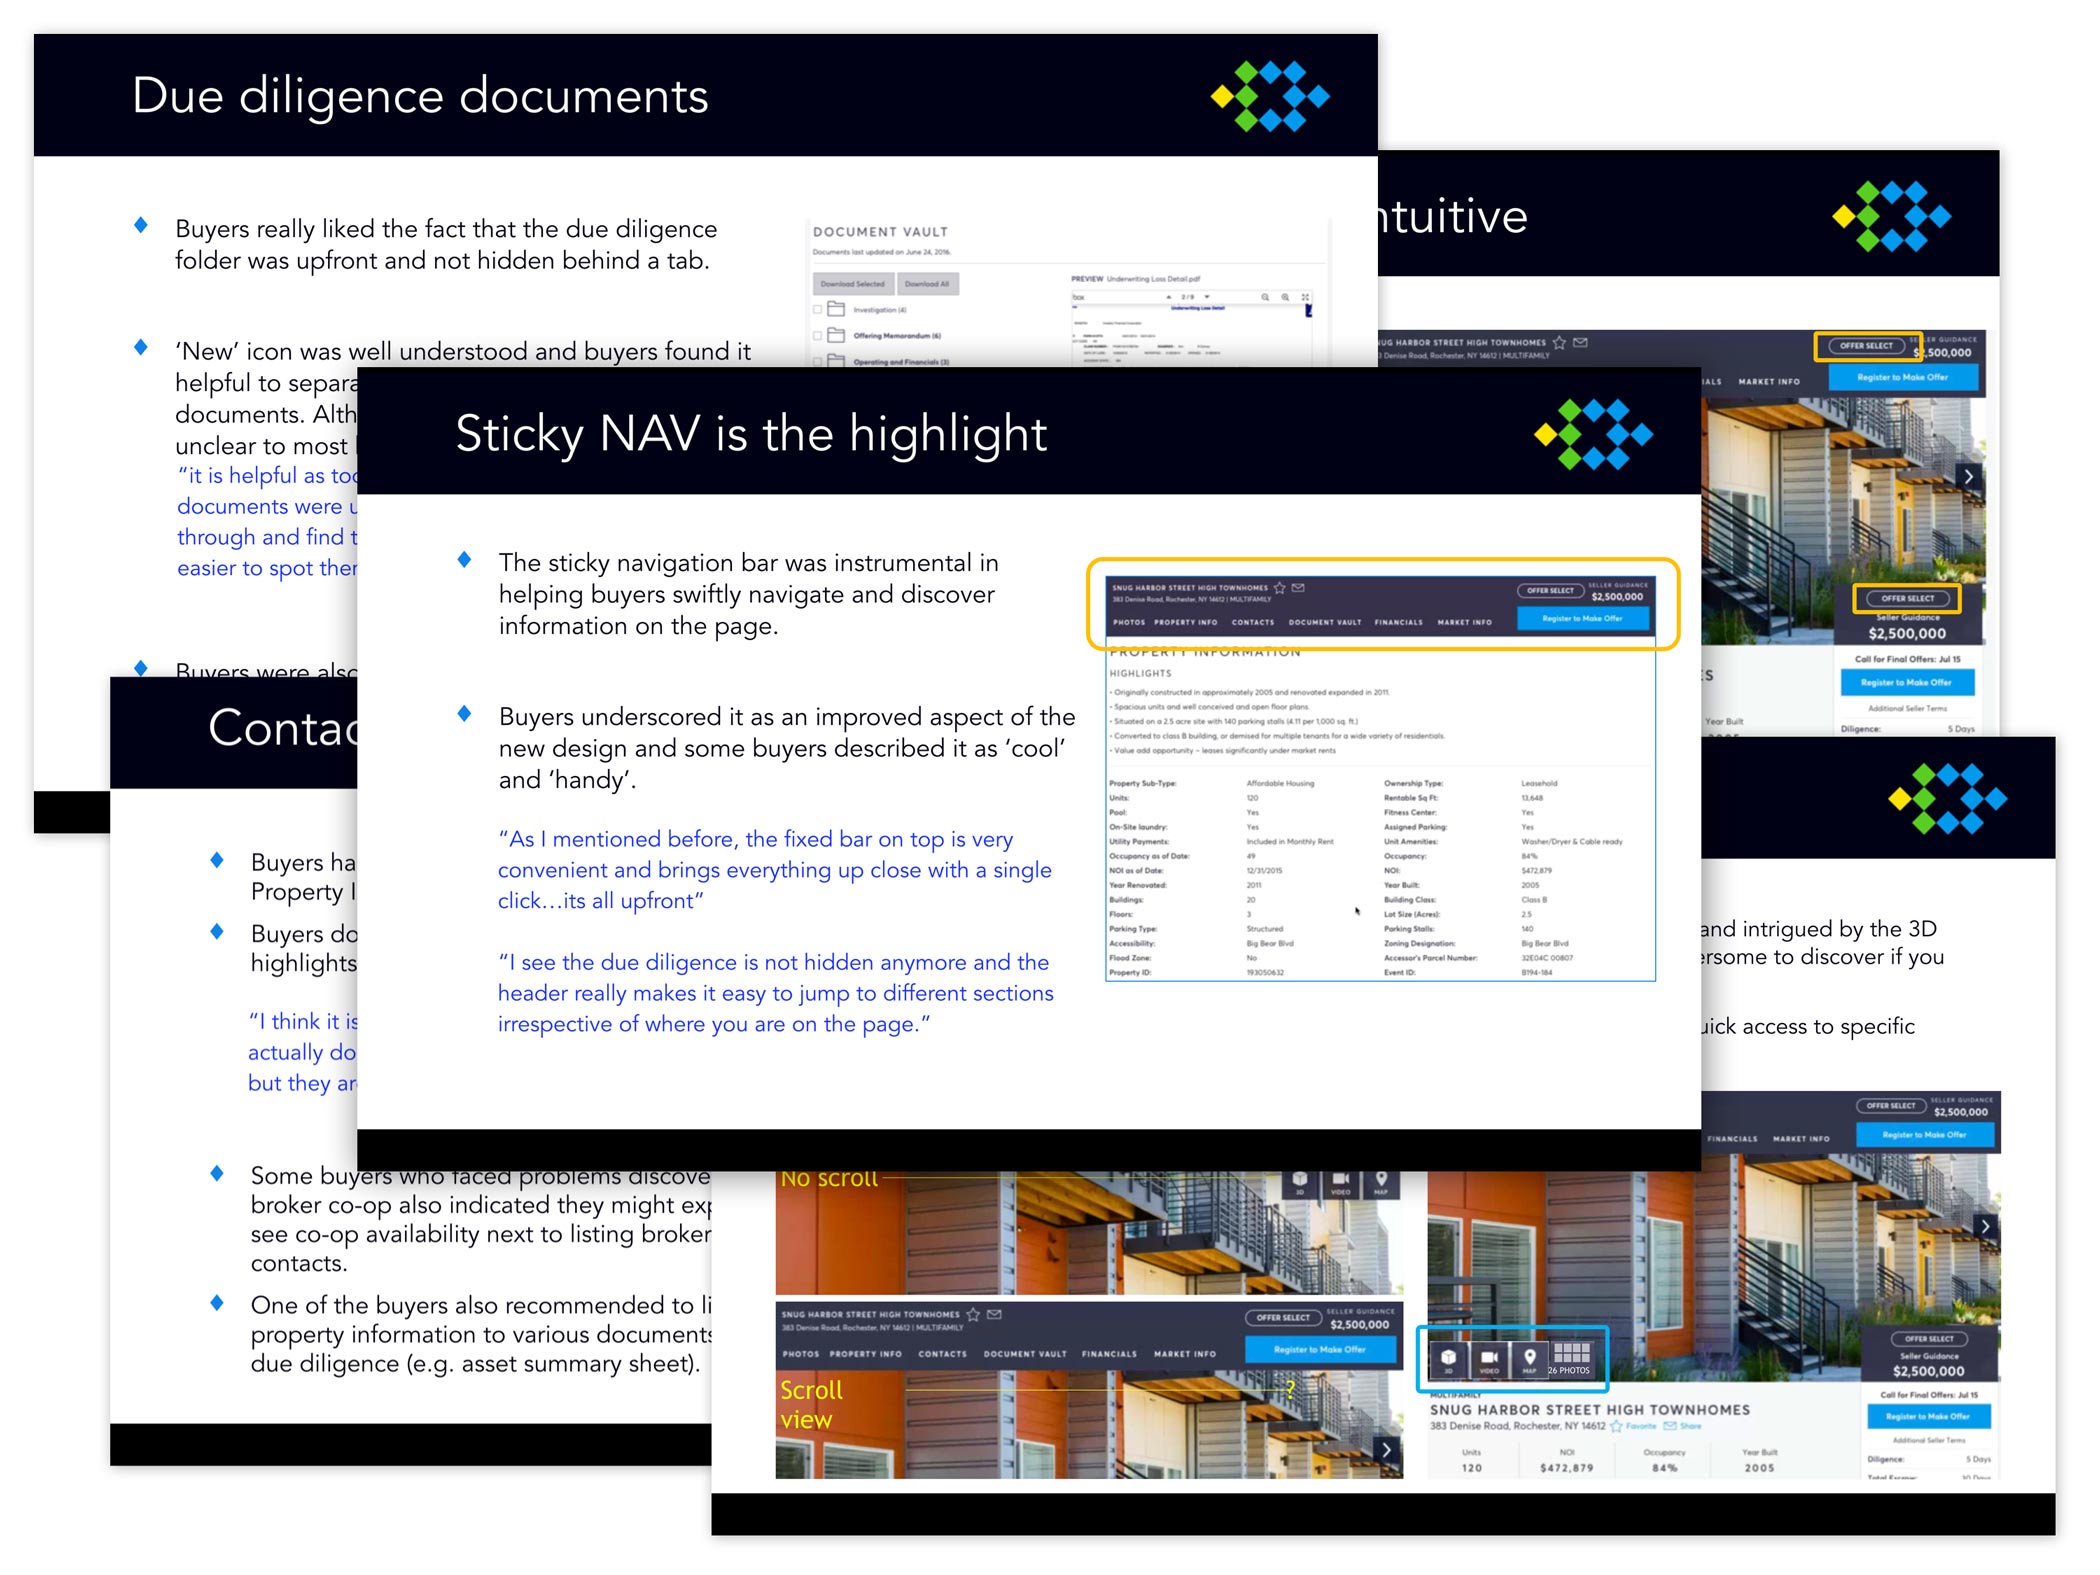
MATERIALIZE PHASE (User Testing)
I then tested the final revised prototype with live users going back to the same list of tasks as the first round of testing to see if those same tasks were failing or successful. We also checked to see if it was resolving previous pain points and observing user behaviors.
MATERIALIZE PHASE (Implementation)
I provided developers with handoffs using toolkit redlines, using component call outs and block measurements.
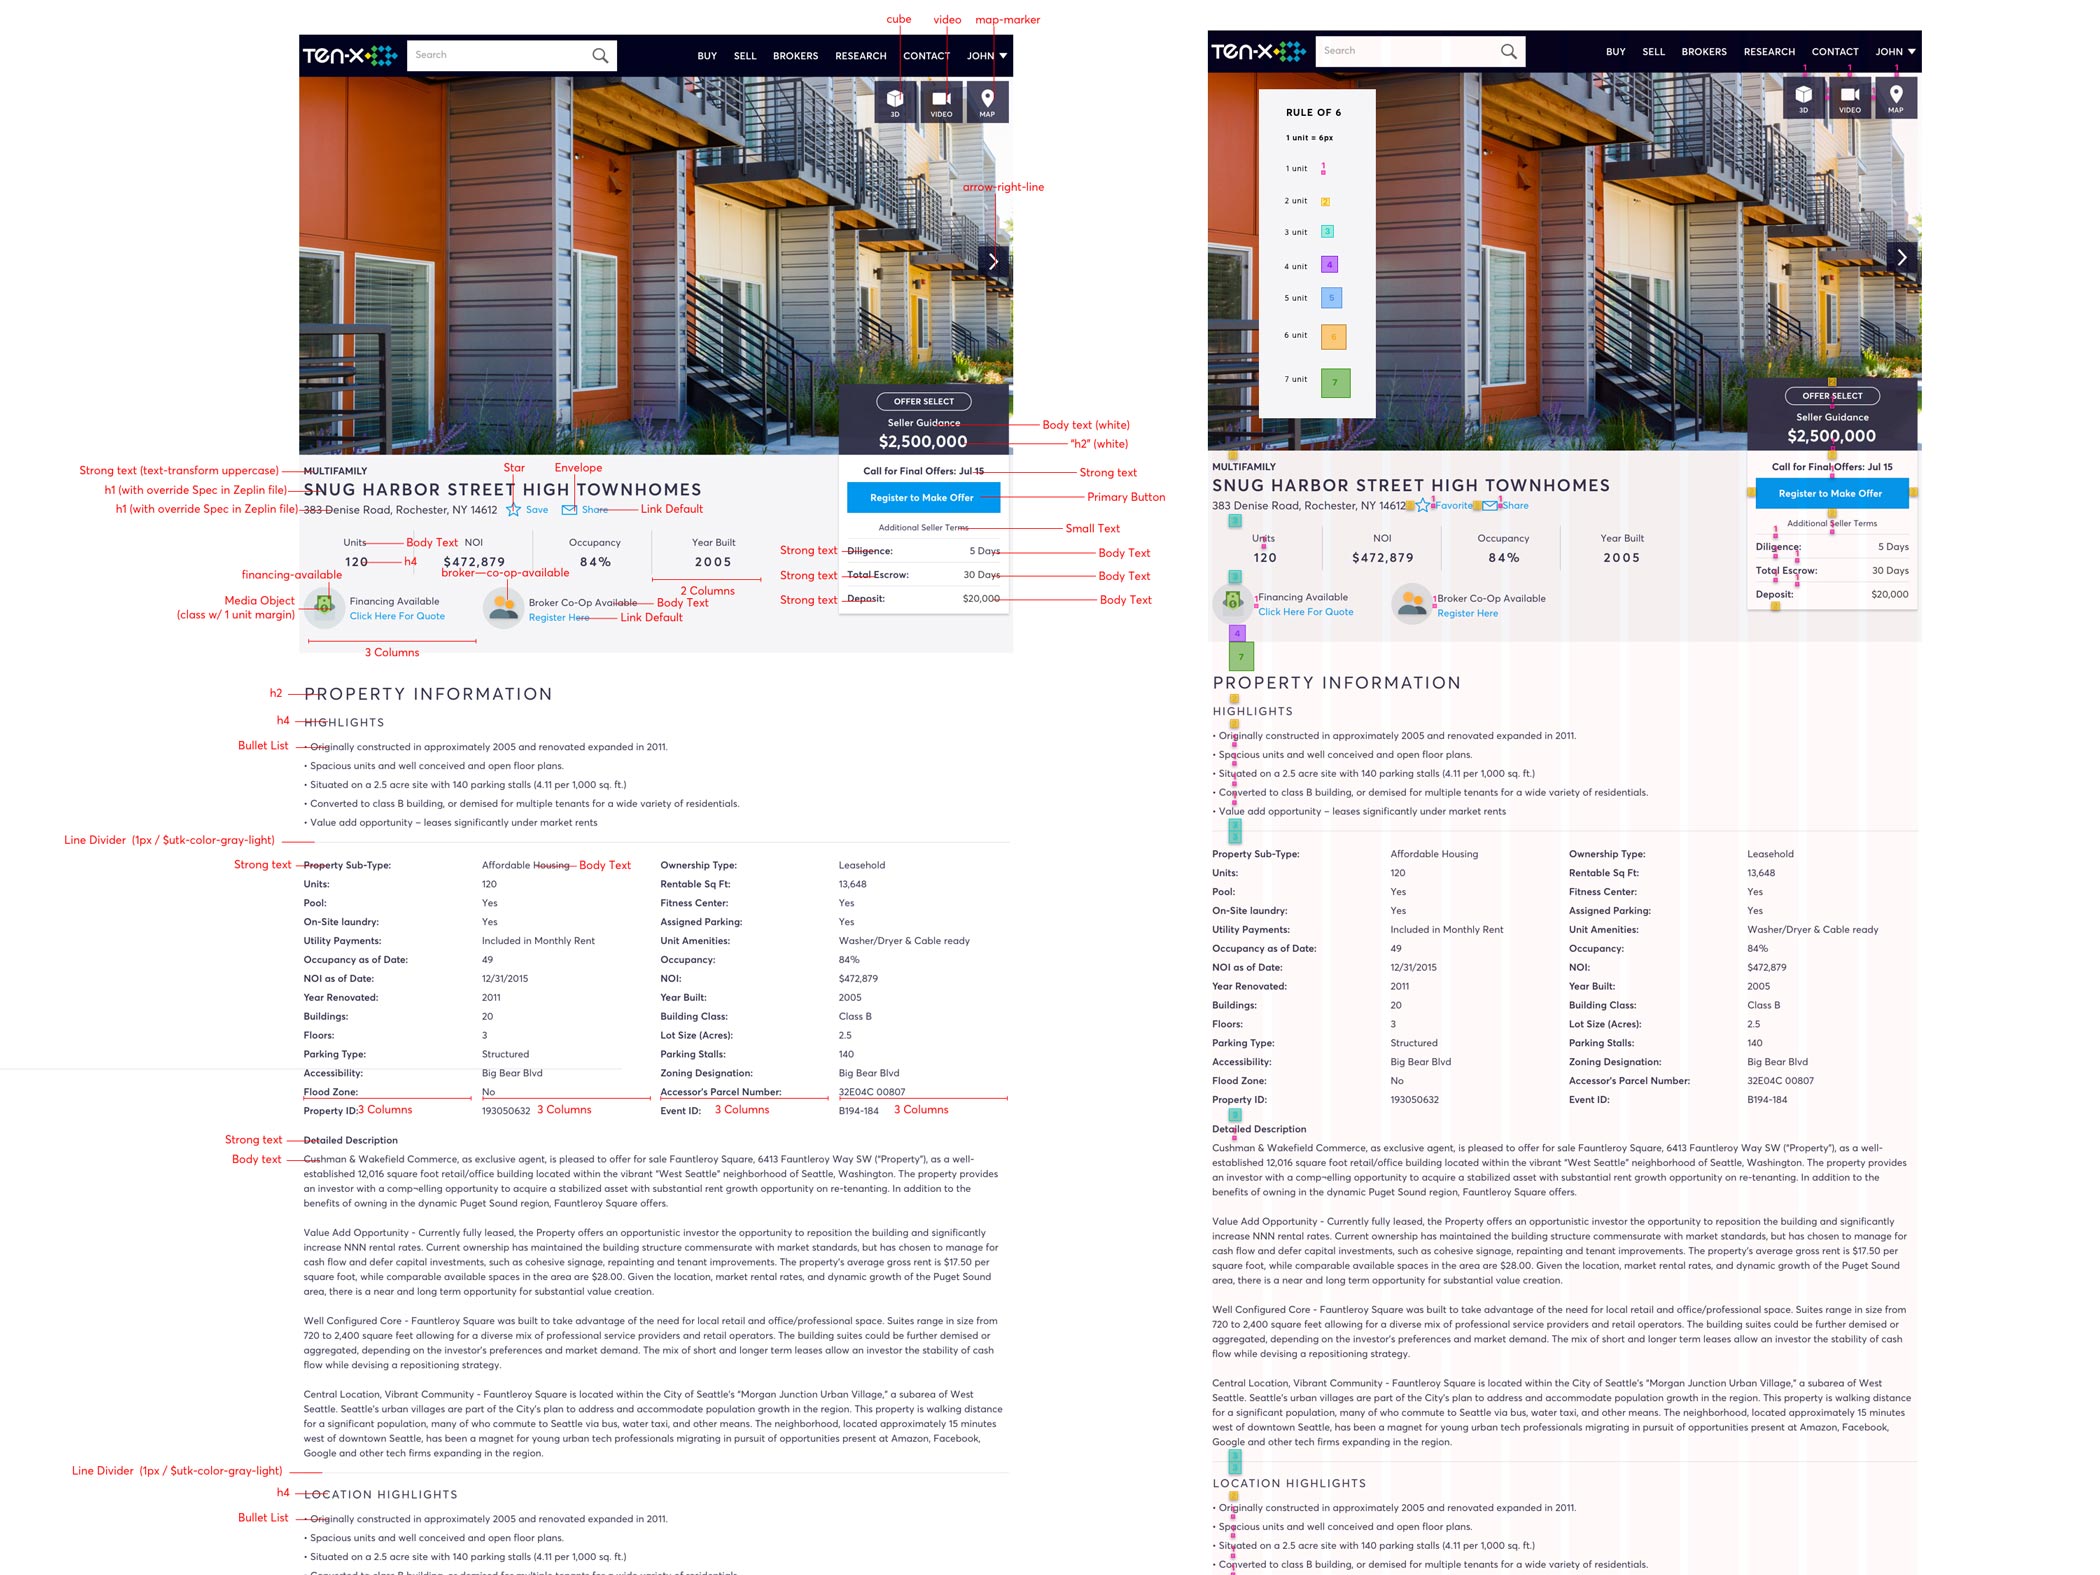
MATERIALIZE PHASE (Implementation)
I also provided Zeplin format to aid with CSS for any visual design one-offs and other specificities.
RESPONSIBILITIES
- Research
- UX
- UI
- Interaction
- Visual
WHAT IS IT?
The Product Detail Page (PDP) is where the customer finds every detail about a particular asset. Anything from media (high resolution photographs, videos, maps, 3D tours, etc) to specific building details (financial information, building occupancy, year built etc) to miscellaneous information (triple net lease asset, platinum sellers, etc). The PDP tends to be the product page that helps determine whether a user will convert from a browser to a customer.
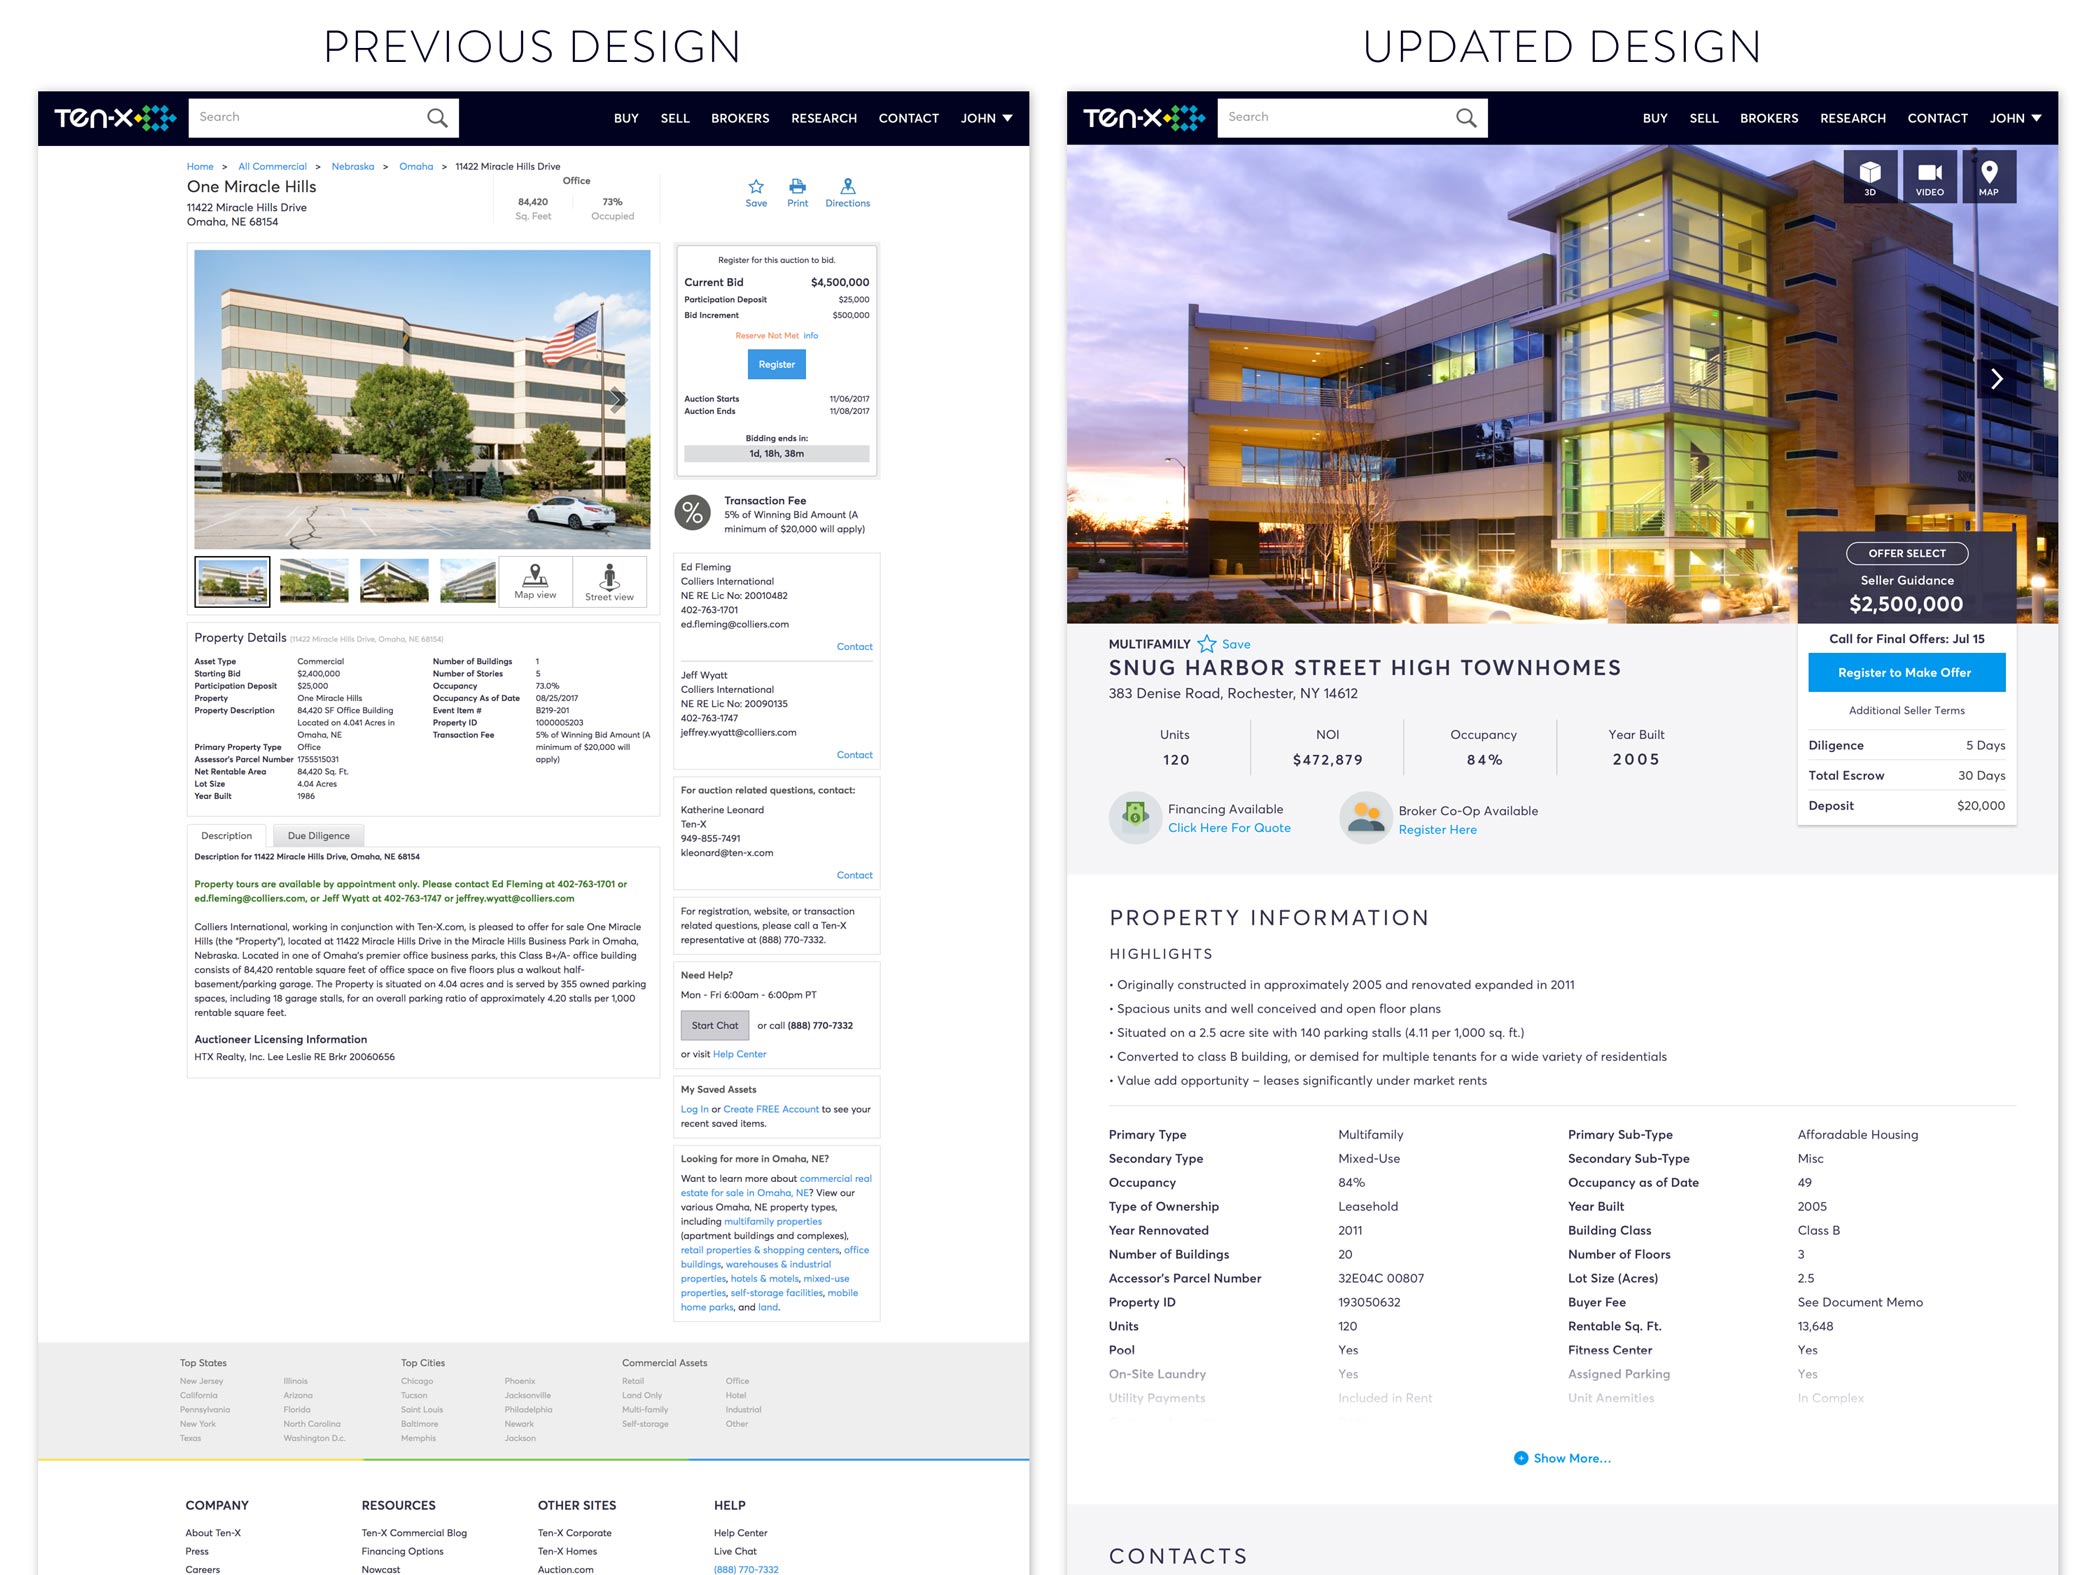
WHAT IS THE PROBLEM?
To answer this question, we must take a few small steps back to get a quick history of the PDP. In 2016, Ten-X went through a major rebrand and split the product into 3 lines of business.
- Wholesale Properties (foreclosure, bank owned, etc)
- Homes (consumer to consumer)
- Commercial (investors & consumers)
Prior to this split, all three lines of business were one product. Essentially meaning that we all shared one home/landing page, one search page, one dashboard, one PDP, etc. The need for the split was absolutely necessary as a one-all-be-all Search page or PDP page was extremely cluttered, hard to filter, and served completely different user needs. For example, a consumer searching for foreclosed properties in their local town is generally not going to be in the market for a million dollar office building in a major metropolis.
Hence, the absolute need for a detail page directed at specific behaviors and types of users.
WHAT IS THE GOAL?
The PDP had a few very specific high level goals:
- Help the user make decisions quickly (too cluttered, hard to navigate, difficult to find and digest information quickly, etc)
- Set up for future scale (optimize for mobile, ability to add and grow, etc)
- Modern design overhaul (updating the visual design but also improving on the UX/UI, etc)
Before designing a solution, we determined these goals by running research sessions and interviews with users. We also interviewed the Ten-X C-Suite (general manager, chief information officer, chief revenue officer, etc) and stakeholders (subject matter experts, business developers, client managers, etc) to gain a deeper understanding of the problem from all sides. We studied analytics in order to understand current user behavior. Based on these research sessions, data metrics and interviews, we developed a vision and strategy for the product team to begin the process.
WHAT IS THE PROCESS?
For the PDP re-design, I used a user centered design approach (keeping continuous tight feedback loops and iterating as necessary). The project was broken down as such,
Understand (Analytics, Research, User Testing & User Feedback, Whiteboarding & Brainstorming) > Explore (Sketching, Wireframes, Competitive & Design Analysis, High Fidelity Designs, Prototypes) > Materialize (Testing & Implementation)
The Understand Phase
- Empathize (Research, Analytics, User Testing, User Feedback)
- We (CX Team and I) brought in a group of users who had bid and won on our platform previously and ask them about specific pain points. We observed user behavior and asked them do a series of tasks. I also observed how they consume the complicated data, what was their process, what was most complicated, their bidding habits, etc (essentially observing their behaviors). A lot of time was also spent on breaking down analytics/metrics for the PDP.
- Define (Whiteboarding)
- I began brainstorming with the product manager in order to break down all research findings and identify problems. I did multiple whiteboard sessions where we brought in stakeholders and product team members. First meeting started with defining user needs, user goals, constraint and assumptions. Other sessions include end-to-end experiences, use cases, user journeys, etc.
The Explore Phase
- Ideate (Sketching, Wireframes, Competitive Analysis, High Fidelity Designs, Feedback)
- The ideation phase is the most intense from a design perspective. There were a lot of sketching, wireframing, high fidelity designs (lots of UI, UX, IA and interaction designs). This phase also included competitive and design analysis. This phase had the most feedback and iterations. This also included some unorthodox and organic feedback sessions with members outside of the product team and a design bash with the product team members (this is where we go through any outstanding questions, concerns or issues).
- Prototype
- I then created several fully functional prototypes and tested them internally with the PDP product team, design team and many of the stakeholders. The goal here was to get as much feedback as possible and fix any issues we may have missed before refining a final prototype to take back to live users for testing.
The Materialize Phase
- Test (User Testing & Feedback)
- I the took the final prototype for another round of live user testing. This new group was then asked to perform the same series of tasks as the first group of users, but now with the new designs. The CX team, myself and the PM then did a retrospective on all the data we had just acquired. This provided the clarity on whether we needed to tweak the design again or begin to clearly set a vision, strategy and finalizing our metrics for success.
- Implement (Handoffs & Deliverables)
- I fine tuned the designs by making sure all visuals assets were created and ready for deliverables. I also made sure that any use cases, edge cases or other complications were well communicated (and documented) within the engineers/QA and myself. During this phase, I communicated to my team that I was 100% available for any feedback, questions and sit-downs.
CONCLUSION
When the new PDP was release, I tracked the analytics very closely as it was important to me to see if how our metrics for success measured up. After 6 weeks, I gathered all data on the PDP from omniture, hotjar, etc. Fortunately, we had hit all of our primary and secondary metrics for success.
- Account Creations from PDP (pre 2.5% vs post 2.9%) for an 18% increase.
- Time Spent on PDP (pre 3.5 vs post 3.7) for a 4% increase.
- Bounce Rate on PDP (pre 26% vs post 24%) for a -11% decrease.
- Page Views per Visitor (pre 1.5 vs post 1.7) for a 13% increase.
- PDP Document Vault Downloads (pre 5.8% vs post 6.5%) for an 11% increase.
My personal retro is that the design challenges were the easier “hard” problems in the overall scheme of things. During this project I had to overcome bigger challenges such a major re-org, change in leadership (new General Manager, new Product Strategist, new CMO, Product manager leaving mid project, etc) and three team shuffles. Throughout all the challenges, we were able to release the PDP within the designated date. So overall, the PDP was deemed a success for the commercial business.