
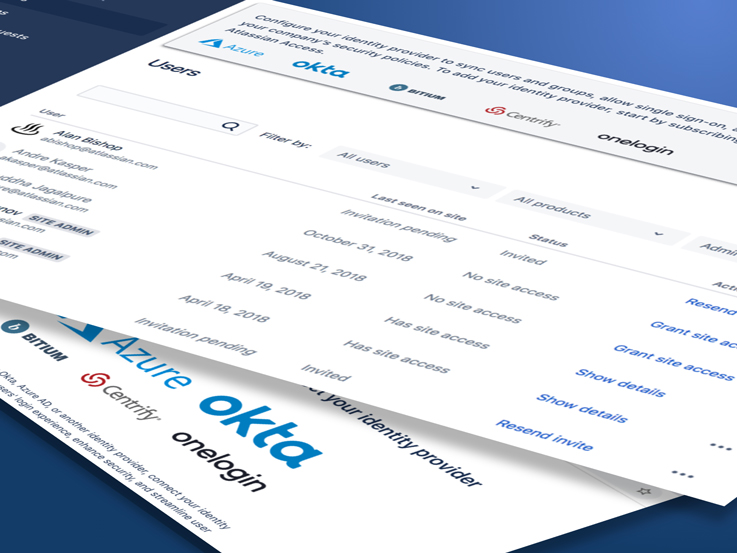
FINAL PRODUCT
Examples of the Awareness growth initiative screens


UNDERSTANDING & GATHERING PHASE
A bulk of my time was spent on dissecting existing data and user behaviors. I dove into quant data with a data scientist. I began breaking down the problem with my triad through whiteboading as well as work with another designer on journey mapping to empathize with the customer through their experience.
Quant data and research

Whiteboarding


Customer journey (conversion & churn)

IDEATE PHASE
I created high fidelity mocks that I sparred in person and async-ly (Mural app) with key stakeholders to gather feedback. I also did early signal testing to validate discovery and comprehension. I then re-iterated the designs accordingly based on the feedback and learnings.


Early signal testing research


REFINE PHASE
After several stakeholder and customer feedback sessions, I put the final designs into an inVision prototype to put in front of live users one last time. Designs are then finalized and are prepared for handoffs.


RESPONSIBILITIES
- Research
- UX
- UI
- Interaction
- Product Management
WHAT IS IT?
We are running a series of growth experiment to understand the top of the funnel of our feature product Atlassian Access. Particularly, we are measuring awareness (from product discovery to starting a trial) and activation (trial to feature enablement). The hypothesis is that by increasing the number of Jira/Confluence site admins who are aware of Atlassian Access, we’ll see a significant increase in the trial of Access in the test group versus the control group.
WHAT IS THE PROBLEM?
Through deep diving into the analytics with a data scientist, we knew the problem is that currently approximately 94.3% (of our targeted cohorts of 11-500 employees) of the Jira/Confluence site administrators are not aware of Atlassian Access today. That meant that only 5.7% of our targeted cohort even discovered the Atlassian Access value prop page.
WHAT IS THE GOAL?
The North Star goal of this project was to hit our company FY19 OKR of 350,000 paid Atlassian Access users (clear business goal). We’d reached 85% of our goal, but needed to improve the funnel through in-product awareness. We hypothesized that targeting customers specifically with Identity Providers would close the data gap. The reason we chose Identity Providers is due to the fact that the few who made it all the way through the funnel and become paid users, approximately 67% used SSO or SCIM (Identity Provider features). Our project goal was to deliver high impact with the least amount of dependencies.
Working close with the data scientist, we determined our metrics for success were:
- Increase awareness of the Atlassian Access discovery value prop page by 8%
- Increase of trial creations in the penetration rate of the test group versus the control group by 5%
Ultimately, for myself as a designer, the learning goal of this project is incredibly important as it’s the first time our Atlassian Access team has done a growth project. We’re hoping to gather data so even if we don’t get users to trial Atlassian Access (one of our key metrics for success), we’d like to learn if users,
- Don’t have an Identity Provider
- Don’t know what an Identity Provider is
- Have an identity Provider, but aren’t interested right now
The reason being that we can leverage this information to inform designs later in the funnel or revise our existing awareness designs.
WHAT IS THE PROCESS?
Much like other projects at Atlassian, the design process was broken down into a variant of the design thinking process all dependent on product scope, roadmap and timelines,
- Understand & Gather Phase
- Used this time to gather context and understanding by collecting and ingesting quantitative (redash) and qualitative (user interviews and feedback) data
- A lot of whiteboarding, summarizing past research and design efforts, and documenting current state (Confluence)
- Creating user journey and flows to help empathy mapping
- Ideate Phase
- Explored the problem space and began high fidelity designs due to time constraints
- Did several prototypes and put them in front of stakeholders feedback
- Wrote a test plan and did early signal testing to validate comprehension and discovery
- Refine Phase
- Put a prototype in front of live users one final time
- Finalized design based on stakeholder & customer feedback
CONCLUSION
This Awareness piece of this project is currently in development with a Q3 2019 release date (Australian quarter, end of March 2019). Con-currently happening is the Activation piece of the project (current project I am working on). Since this project is a growth initiative, it was very important to track the data very closely. Aside from our metrics for success, we are opting for learning to understand user behaviors as well.