FINAL PRODUCT
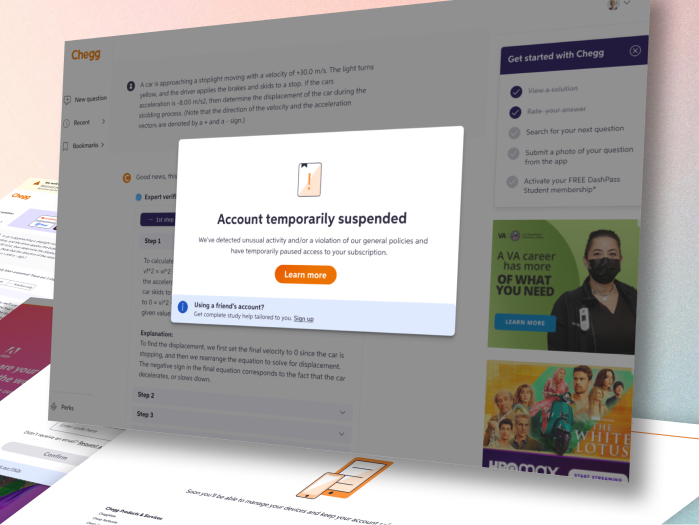
A few examples screens of the Service Abuse initiative ranging from Detention, Device Management and MFA(s).


DISCOVERY PHASE
The first step of the Discovery Phase was the understanding and gathering process which began with a lot of quant data deep dive and customer service direct feedback from users. It was important to validate our hypotheses and to understand user sentiment.
Quantitative Data (deep dive into the quant data to try and validate the anomalies hypothesized)
↓

Customer Service Team Insights/User Feedback (collected all the verbal feedback from student advocate interviews, scrubbed through dozens of pages of call/chat logs, interviews, etc)
↓

Research Plan & Outcome (wrote the exploratory research plan and worked with Researcher on execution plan — then shared research outcome with team & stakeholders)
↓


Competitive Analysis Did a robust design/architecture/product competitive analysis of how other products handle account sharing, Device Management and MFA.
↓


IDEATE PHASE
There was an ideation phase for each of the phases of Account Sharing. It consisted of numerous items such as whiteboarding, user flows, wireframes, competitive analysis, high fidelity and prototypes.
Whiteboarding First thing I did was get in a room with the PM and lead architect on the project and we white boarded all the use cases and talked through any constraints or dependencies
↓

Eng Flows (following white boarding sessions, I created engineering flows to break down and understand the logic further. This part is particularly important for me because platform logic tends to be extremely complicated and nuanced. Below are examples of device management and MFA via app)
↓


Wireframes (I then went through multiple low fidelity wireframes which I shared with the team often and early to solicit feedback and get alignment)
↓

High Fidelity (once we locked the UX in low fidelity mode, I moved on to high fidelity designs where the focus was more on design systems & Chegg-UI components with rapid feedback and iteration sessions)
↓


Prototype & User Testing (after locking on the direction and final UI, I put together some prototypes in Framer which we put in front of users, both in moderated testing as well as unmoderated testing to get more signals)
↓


REFINE PHASE
After refining the UX in wireframes and putting all the UIs into high fidelity designs, I then garnered feedback internally (with immediate product team, stakeholders and design critiques) and made final revisions for handoffs. This included a last round of feedback from content design and legal to prep for our UXQA and dogfooding sessions.
Internal Feedback (final stakeholder steering committee shareout for feedback with Figjam)
↓

Final Design Revisions (some example final designs)
↓


RESPONSIBILITIES
- Research (wrote initial exploration research plan and worked with Researcher for qual sessions)
- UX
- UI
- Interaction
WHAT IS IT?
While working on platform features to reduce error in sign-ups (to increase conversion) along with compliance projects (Apple forcing social sign on by a certain date if you had an app in the apple store, etc), the security platform PM approached me and said he might have found an opportunity to affect one of the company north star metric / OKR (targeting 20% YoY subscriber growth). He mentioned that he noticed some accounts had more than 20 devices per day all logged from different IPs (different states, sometimes different countries). Together, as a side passion project on top of our own workloads, we tackled it in two parts.
- Quant Data: Talking to data science to verify the anomalies in the quant data as well as using our data dashboards (using Domo, Adobe and Tableau)
- Customer Service Team: Talk to the SAT (student advocate team) on calls regarding student pain points around access to their accounts as well as scrub call and data logs
If we were to synthesize the data, we could say for every paying customer at Chegg, there are two who are not.
WHAT IS THE PROBLEM?
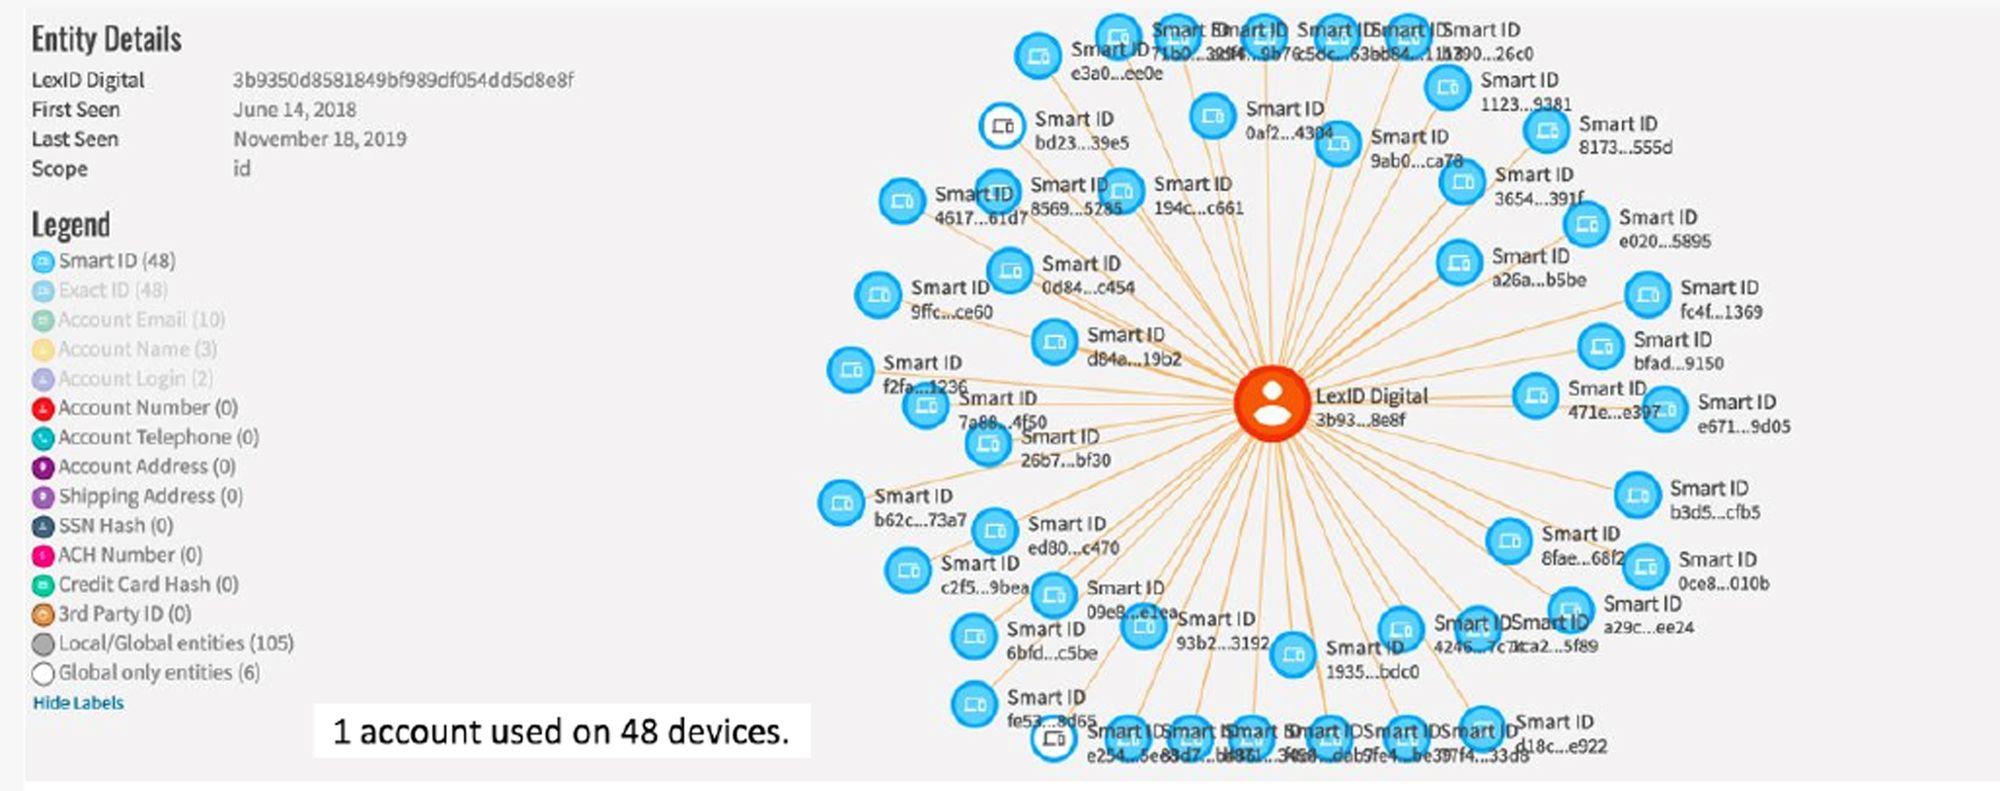
During the security audit, we observed that 60% of all Chegg Study users were sharing accounts in one way or another. In the most malicious cases, a single account was used on 48 devices.
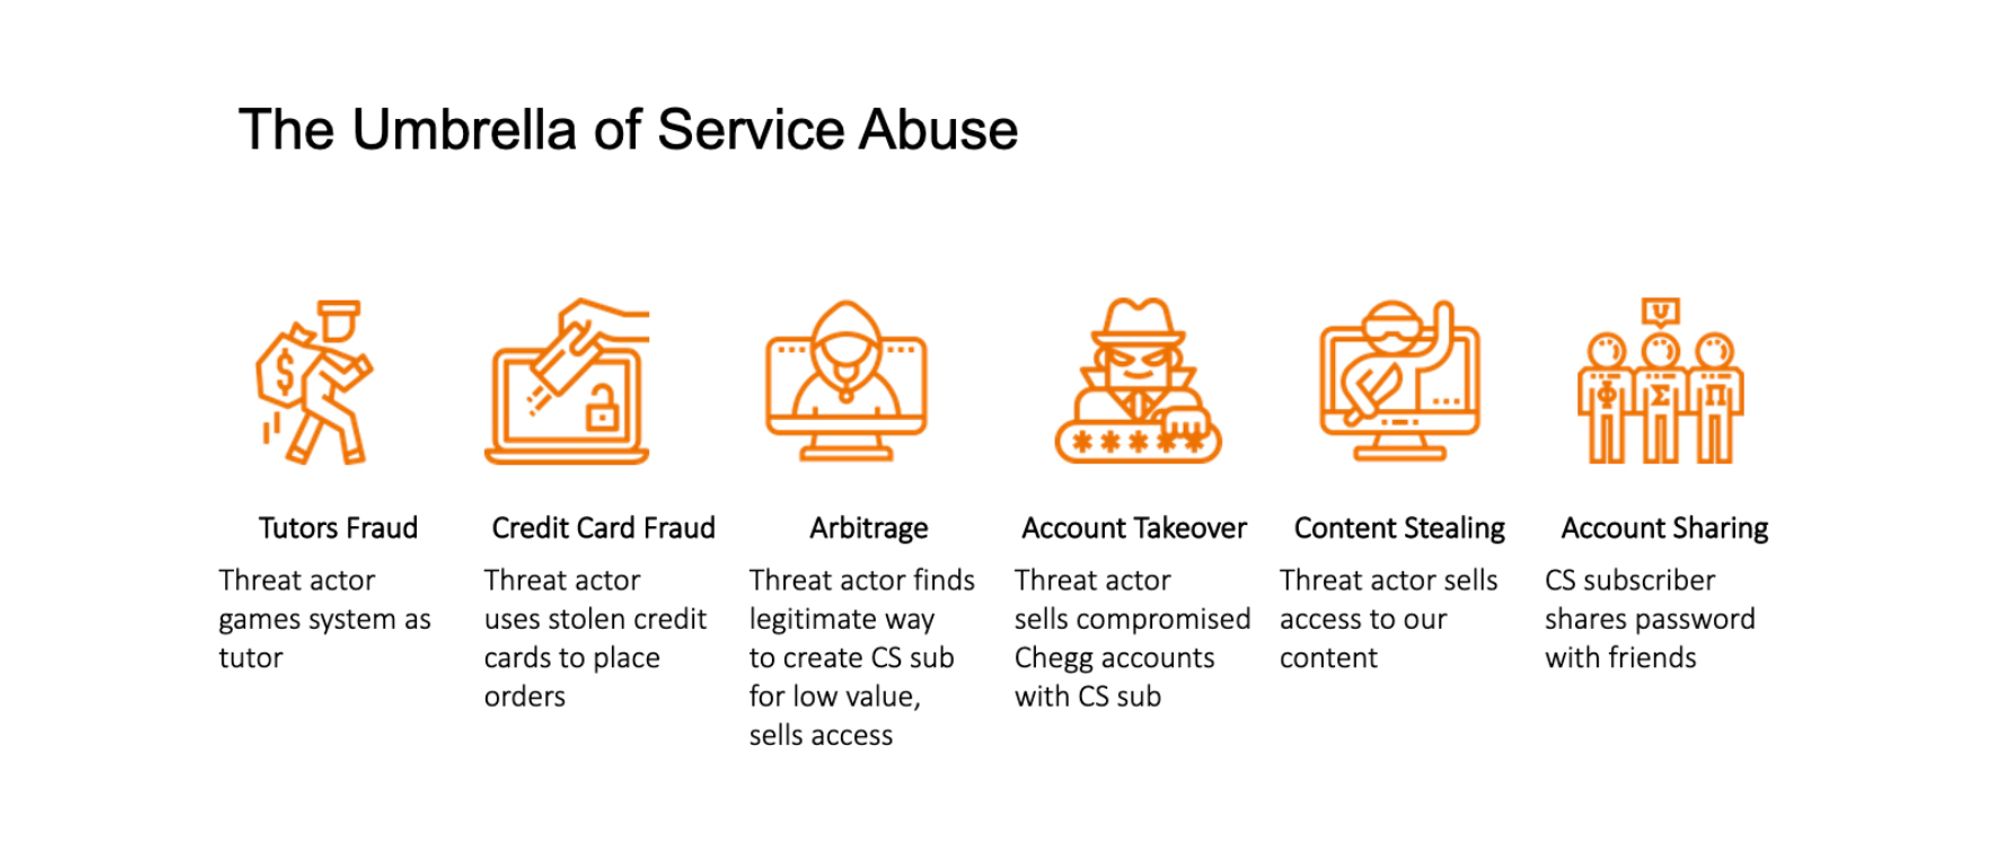
Chegg had always seen users as one big monolith set of users but there was a lack of understanding the segmentation within this student set. So the problem we were solving were:
- Identify and segments specific types of account sharing users and to bucket them into categories
- Single out the category which was hurting the business at large and target them for spin-offs (new accounts created after being locked out from sharing)
WHAT IS THE CHALLENGE?
The product specific challenge was our security team at Chegg worked with a third party service named TMX (ThreatMetrix) to identify fraud. TMX does a great job of identifying fraudulent activities (account takeovers, identifying bots, etc) but not a great job at identifying account sharing. This led to the Identity team trying to solve the account sharing problem internally. This combined with the typical org level challenges provided additional layers of difficulty.
Show More: Detailed examples of these can be seen below in this toggleWHAT IS THE GOAL?
- The user need was to secure student’s accounts in order to keep their data safe. We needed to create a policy that would not add too much friction to the existing user but rather target malicious users. This meant some innocent users could get caught in the crossfire so the design/architecture goal was to create logic and designs that would reduce false positives (non-malicious sharers) as much as possible and encourage spin-offs (new sign-ups).
- The business goal was to have students stop malicious account sharing and to nudge sharers to sign up for their own subscription spin-offs.
WHAT IS OUR METRIC FOR SUCCESS?
The hypotheses was if we ship features/tactics to curb Account sharing, then we will observe 5% lift in conversion against the plan and 95% decline in account takeover because we know that more than 10 devices a day is a strong indicator of account sharing (students don’t see sharing their Chegg account credentials as a violation of honor code listed in the terms of service). Success for the project is measured with two keys points:
- Measure the number of spinoffs (new accounts created from being locked out from sharing) + Measure the percentage of users with 10+ devices a day
- Also measuring counter metrics measuring cancelations and number of customer service contacts (DNH metric)
These two metrics together help us validate the truth data (identify the potential of false positives to help inform our data model).
WHAT IS THE PROCESS?
The project was very fast moving and high priority as soon as the red flags were identified and the quant data was synthesized. Leadership decided to make the top priority for the Identity & Access Management team, Trust & Safety team and Security team. Account Sharing was then broken into 4 phases with separate execution timelines,
- Phase 1 – Detention
- Phase 2 – Device Management
- Phase 3 – MFA via Email
- Phase 4 – MFA via App
The design process for each section was broken down into variants following the design thinking phases:
- Discovery Phase (Understanding and gathering phase of Quant Data, Customer Service Interviews, Qualitative research and Competitive Analysis)
- Ideation Phase (Low fidelity & high fidelity variants based on product team feedback, leadership visibility meetings and UX/design system feedback reviews, and real user early signal testing feedback)
- Refine Phase (Revisions based on user feedback, stakeholder feedback and A/B testing data feedback)
↳ DISCOVERY (empathize and define phase)
Luckily, I had already begun the initial discovery phase when myself and the PM divided and conquered the quant data (with data science and analytics) as well as the in depth interviews with the customer service team (regarding student pain points with their accounts). The next step in this phase was to was to request a user research resource (we did not have dedicated UX researchers at Chegg) to do a deeper dive to gather as much info as we could about account sharing and account security by meeting with students. Ultimately, what I wanted to see from the user research was:
- If this new qualitative data we gathered from specific niche users would align with the previous quant data and customer service team data
- Understand our specific user sentiments around their accounts (as well as around sharing accounts)
- Gather enough data that all the qualitative interviews that we could categorize and target users accordingly (the problem statement above we were trying to solve)
↳ IDEATION (ideate, prototype & test phase)
For the Ideation phase, I reverse engineered the “hard date” and came up with a project plan (this was done for each of the 4 phases listed above, each varying depending on scope and timeline). This project plan is essentially a detailed Design Brief I wrote in Confluence to be transparent into the design process and design timeline. I referred to this design brief as the design source of truth and referenced back to it during the entirety of the project. I told the product team exactly what I was cutting out, what I needed and what I absolutely could not cut out. I submitted a detail outline/checklist. I identified the current stakeholders, research, content, data science, legal, product marketing, etc. I logged all my meetings with detailed notes and specific stakeholders feedback in the design brief. With a project that had such high visibility, designs were shared often and early in Confluence and Figma to gather a-sync feedback. Rich fidelity prototypes were created in Framer for live moderated user testing.
When it comes to design feedback, there are 3 specific types (each with multiple syncs):
- Immediate product team feedback (working team whom you whiteboard, architect and design the product with. PM, PMO, Eng, QA, etc)
- Stakeholder feedback (the platform folks who may be accountable, supported, consulted or Informed)
- UX/UI/Content Design feedback (both smaller enablement platform design team and larger company wide design team whom normally would not have visibility into these projects for nuanced and specific design related feedback)
↳ REFINE (revision and finalize phase)
During the refine phase, similarly to the ideation, I went through rapid final feedback with a smaller refined group as at this point, it was more refinements and final cleans ups based on user testing and internal feedback. This phase was also to ensure QA and track the A/B test and control cells to confirm we were DNH (do no harm) to the product. It was also important to keep a close eye on the quant data and customer service team’s feedback in order to rapidly iterate in any fast follows or feature updates.
CONCLUSION
This project was very platform and stakeholder heavy. Our primary metric for success was to “do no harm” to the conversion of our flagship product (this is our company’s “keep the lights on” product). Our buffer for error was extremely small, if we even hit a 1%-2% decrease (overall annual average) was not tolerable. Nothing could have been done without multiple eyes and deep scrutiny involved. In fact, this project answered directly to our CEO and VP of Learning Services who were the final approvers in our DACI (https://www.atlassian.com/team-playbook/plays/daci) model (internally called the “steering committee”). Ultimately, not only did it not harm metrics but it was a huge monetary success.
Product Data Metrics
- With the launch of the phase 1 signal feature (detention), we observed 124K incremental acquisitions against control cell
- Overall the Account Sharing program has led to 413K Incremental subscriptions (14% lift) and ~ 39 million in revenue.
- Reduced the Conversion funnel Churn by 17% through A/B testing leading to 2% CVR lift.
Security Data Metrics
- Account Takeovers are down by 98%
- Students calling regarding losing access to their account now only made up 1% of all customer service calls (something like 60%+ drop in calls with estimates of each Student Advocate Team call costing Chegg approximately $6)
↳ Learnings and Follow-ups
Till this day, I still log and collect quant data feedback on account sharing through our analytics dashboard as well as attend a regular sync with the customer service team (student advocate team) collecting/discussing user feedback, aptly named “Customer Voice”. I keep t an active Jira backlog of priorities ranging from p1s-p4s to keep as fast-follows or must-haves inclusions for the next phases.
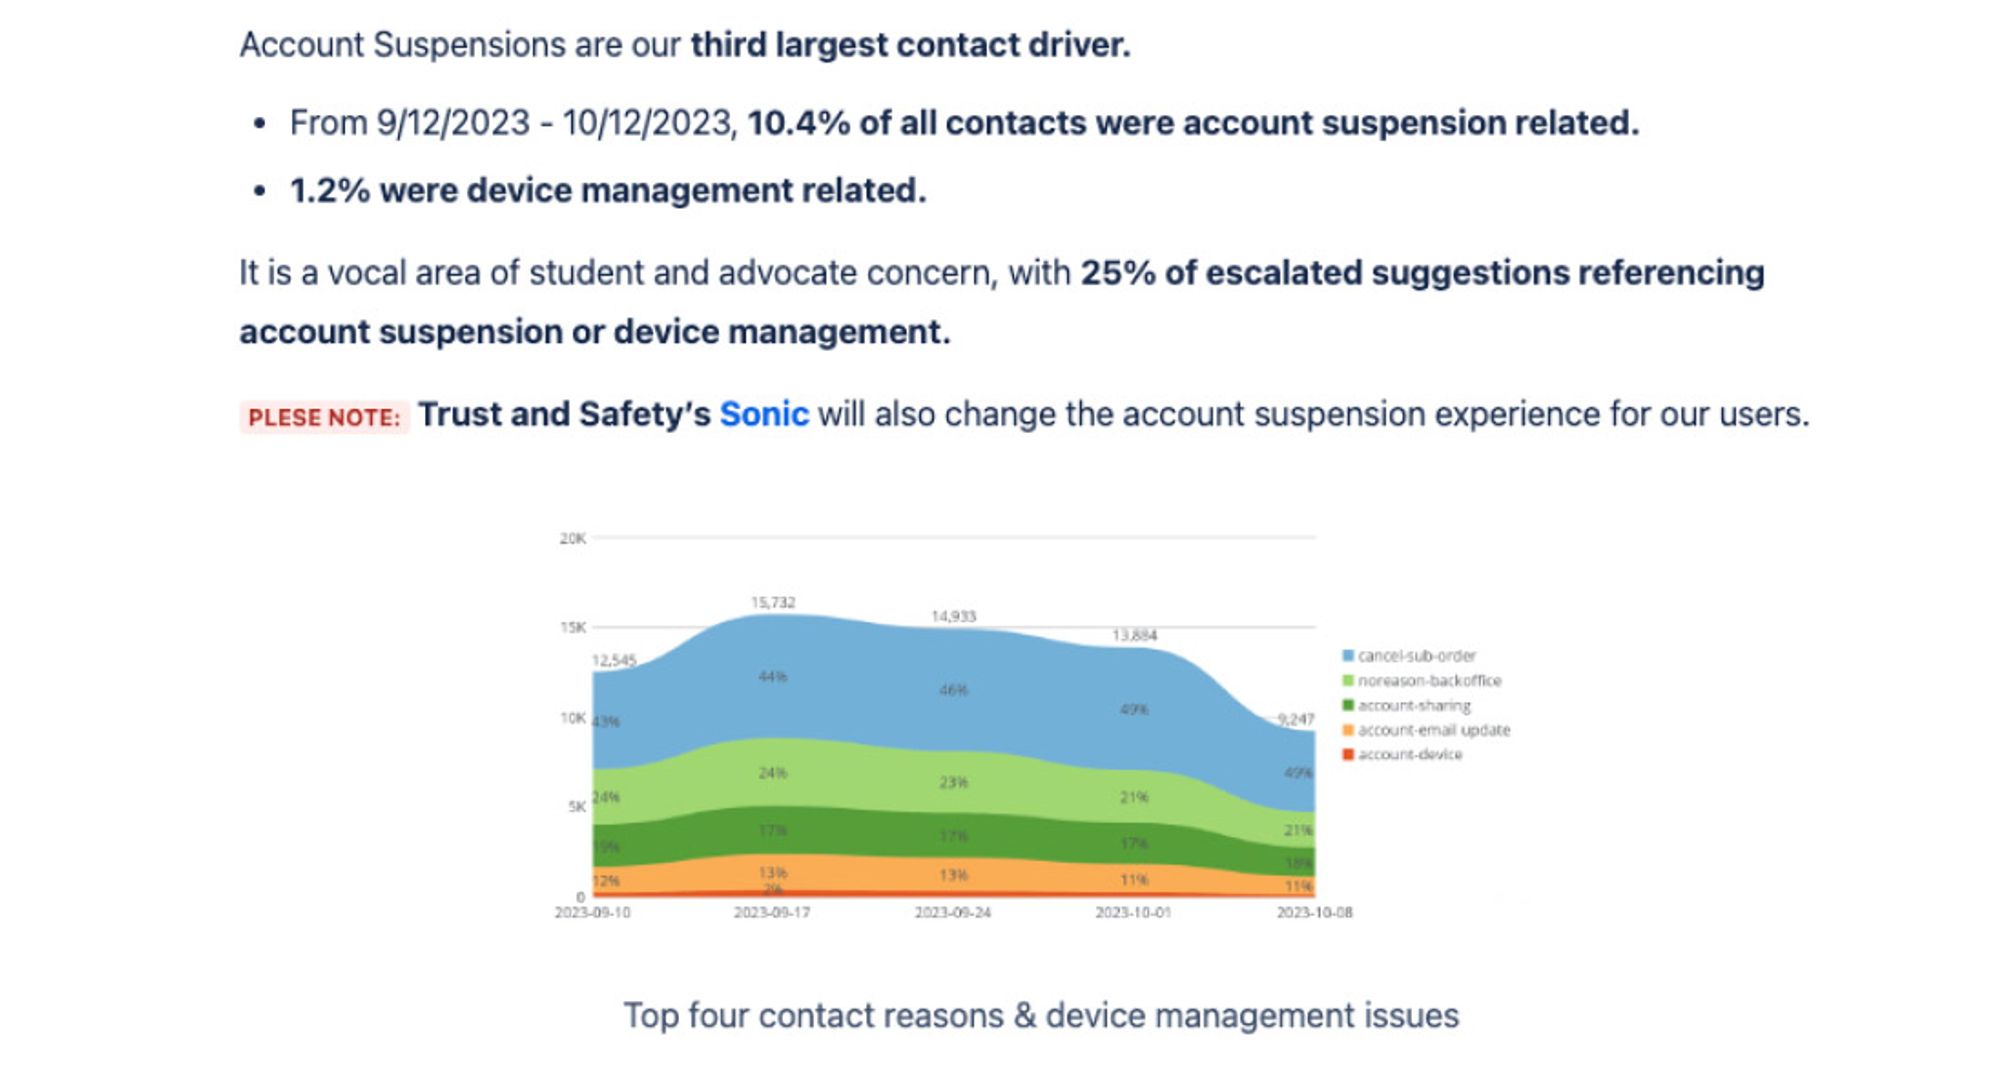
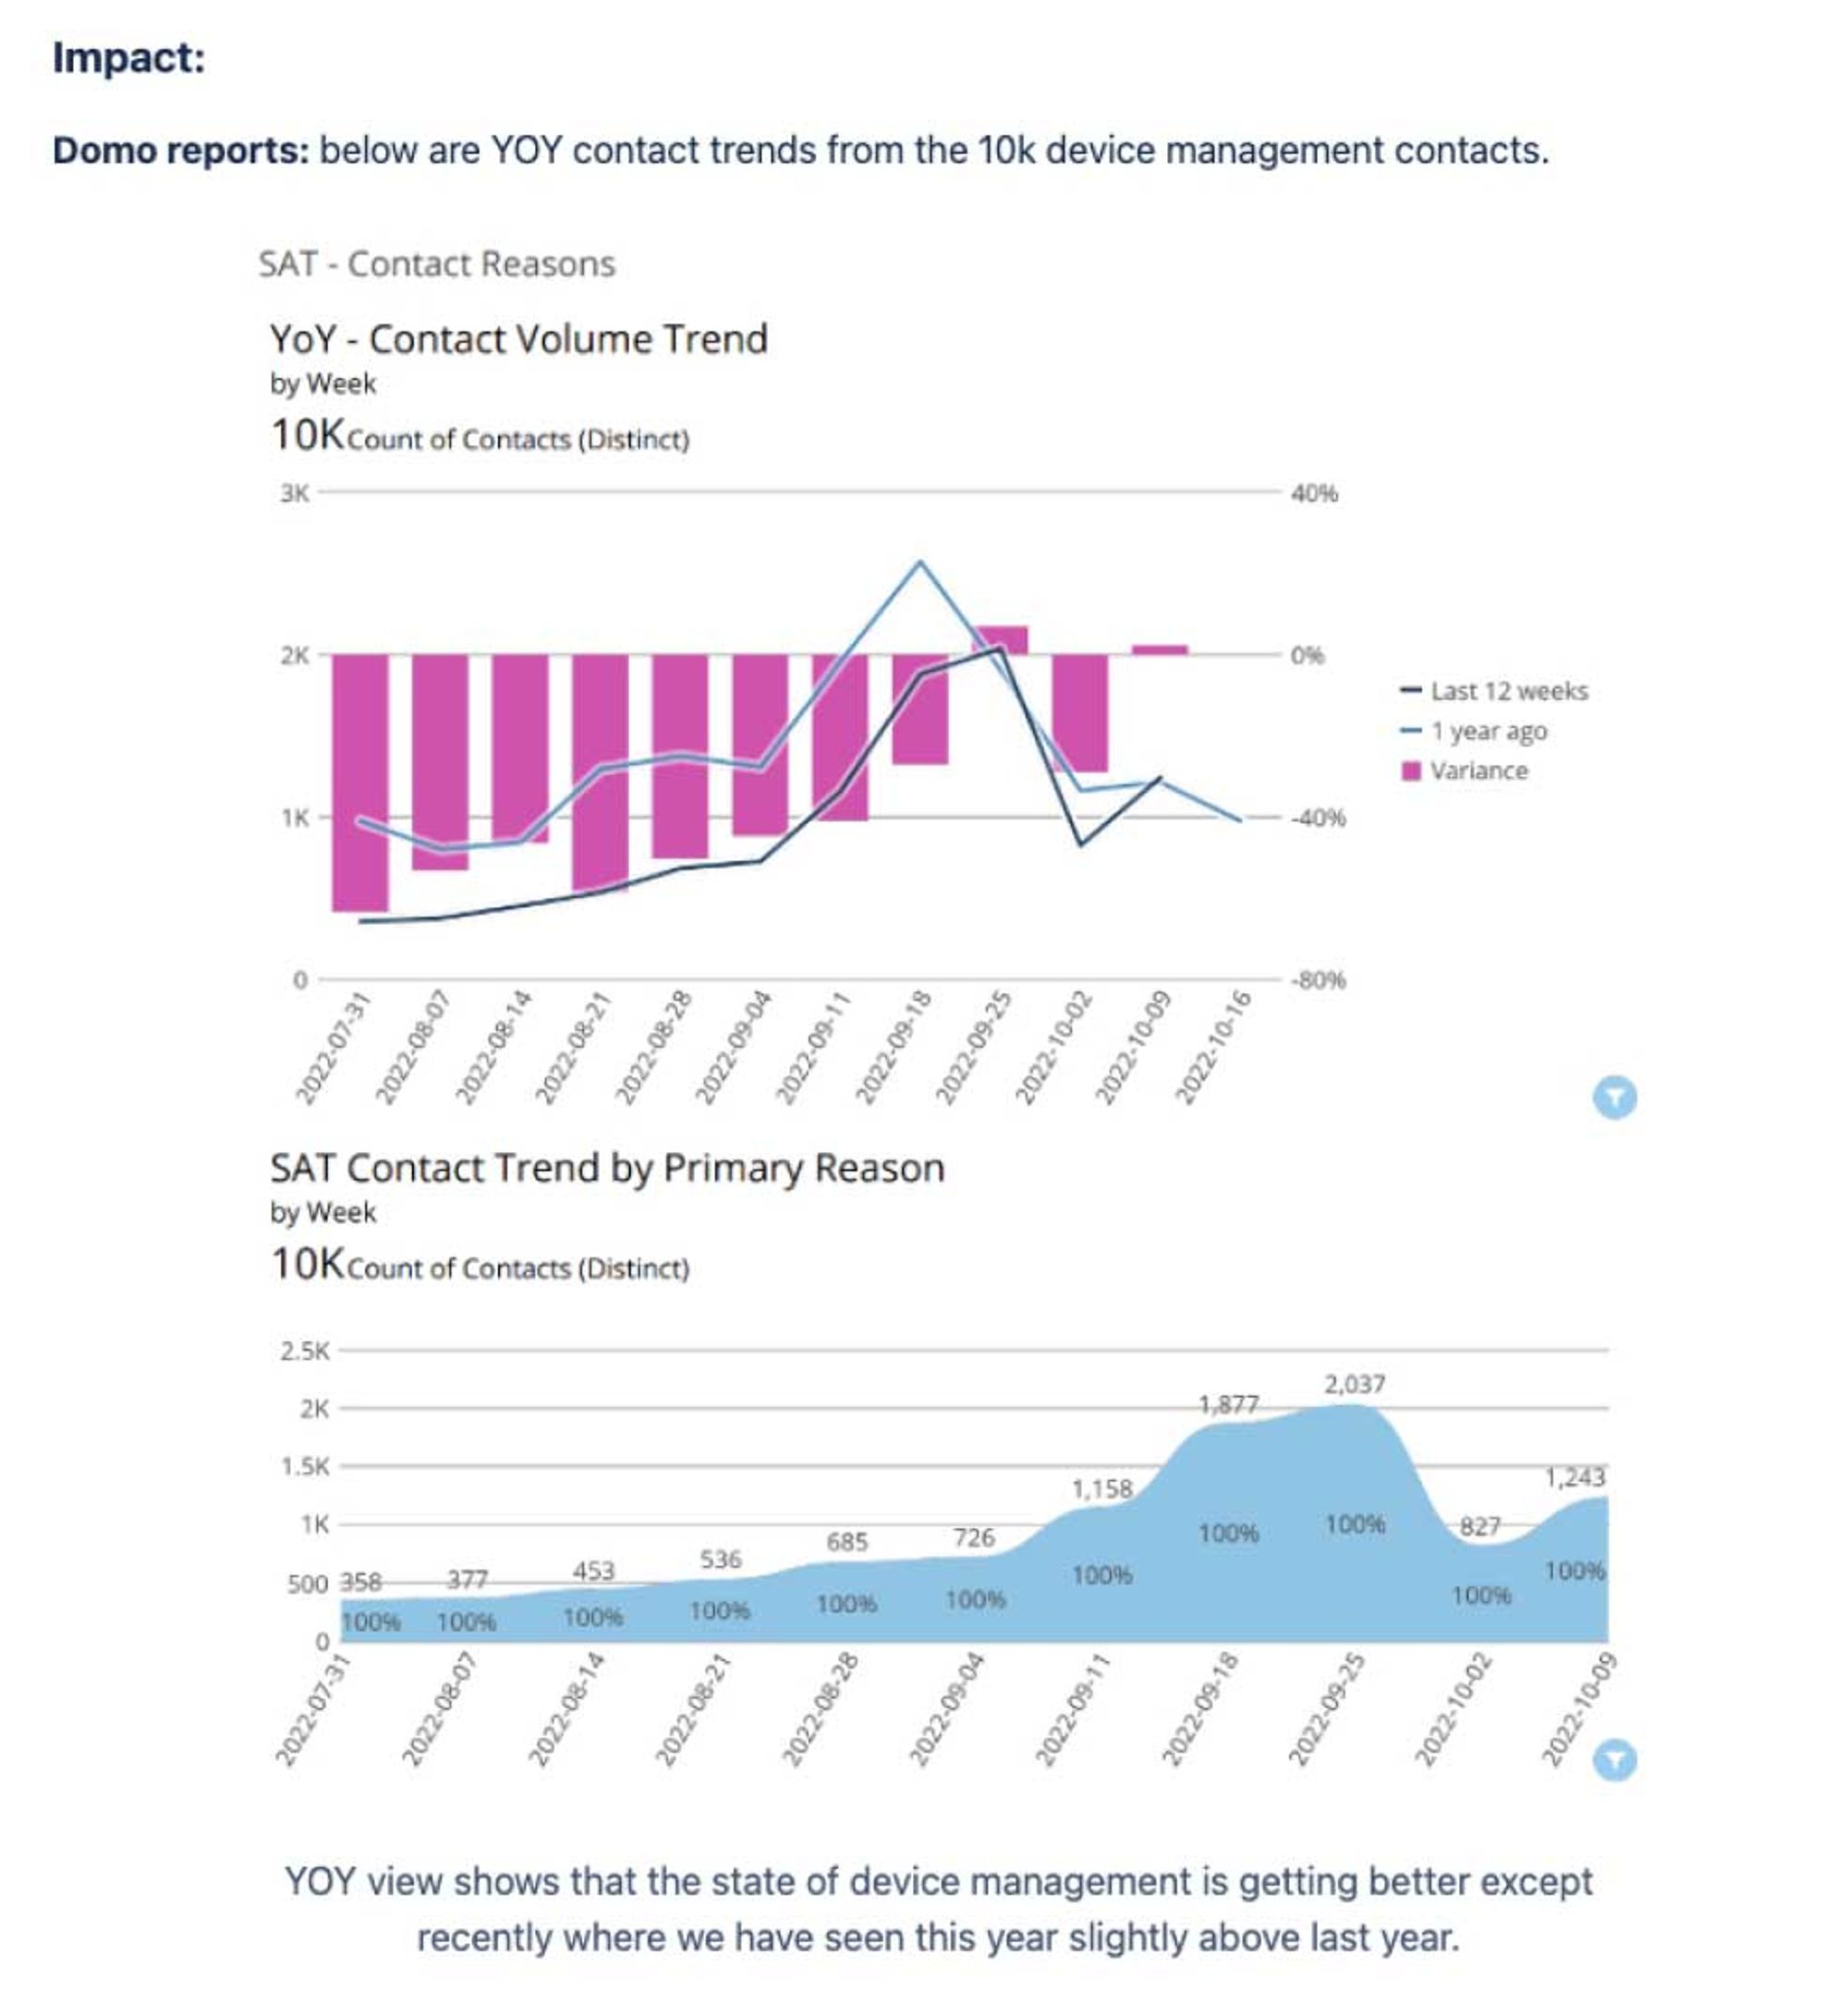
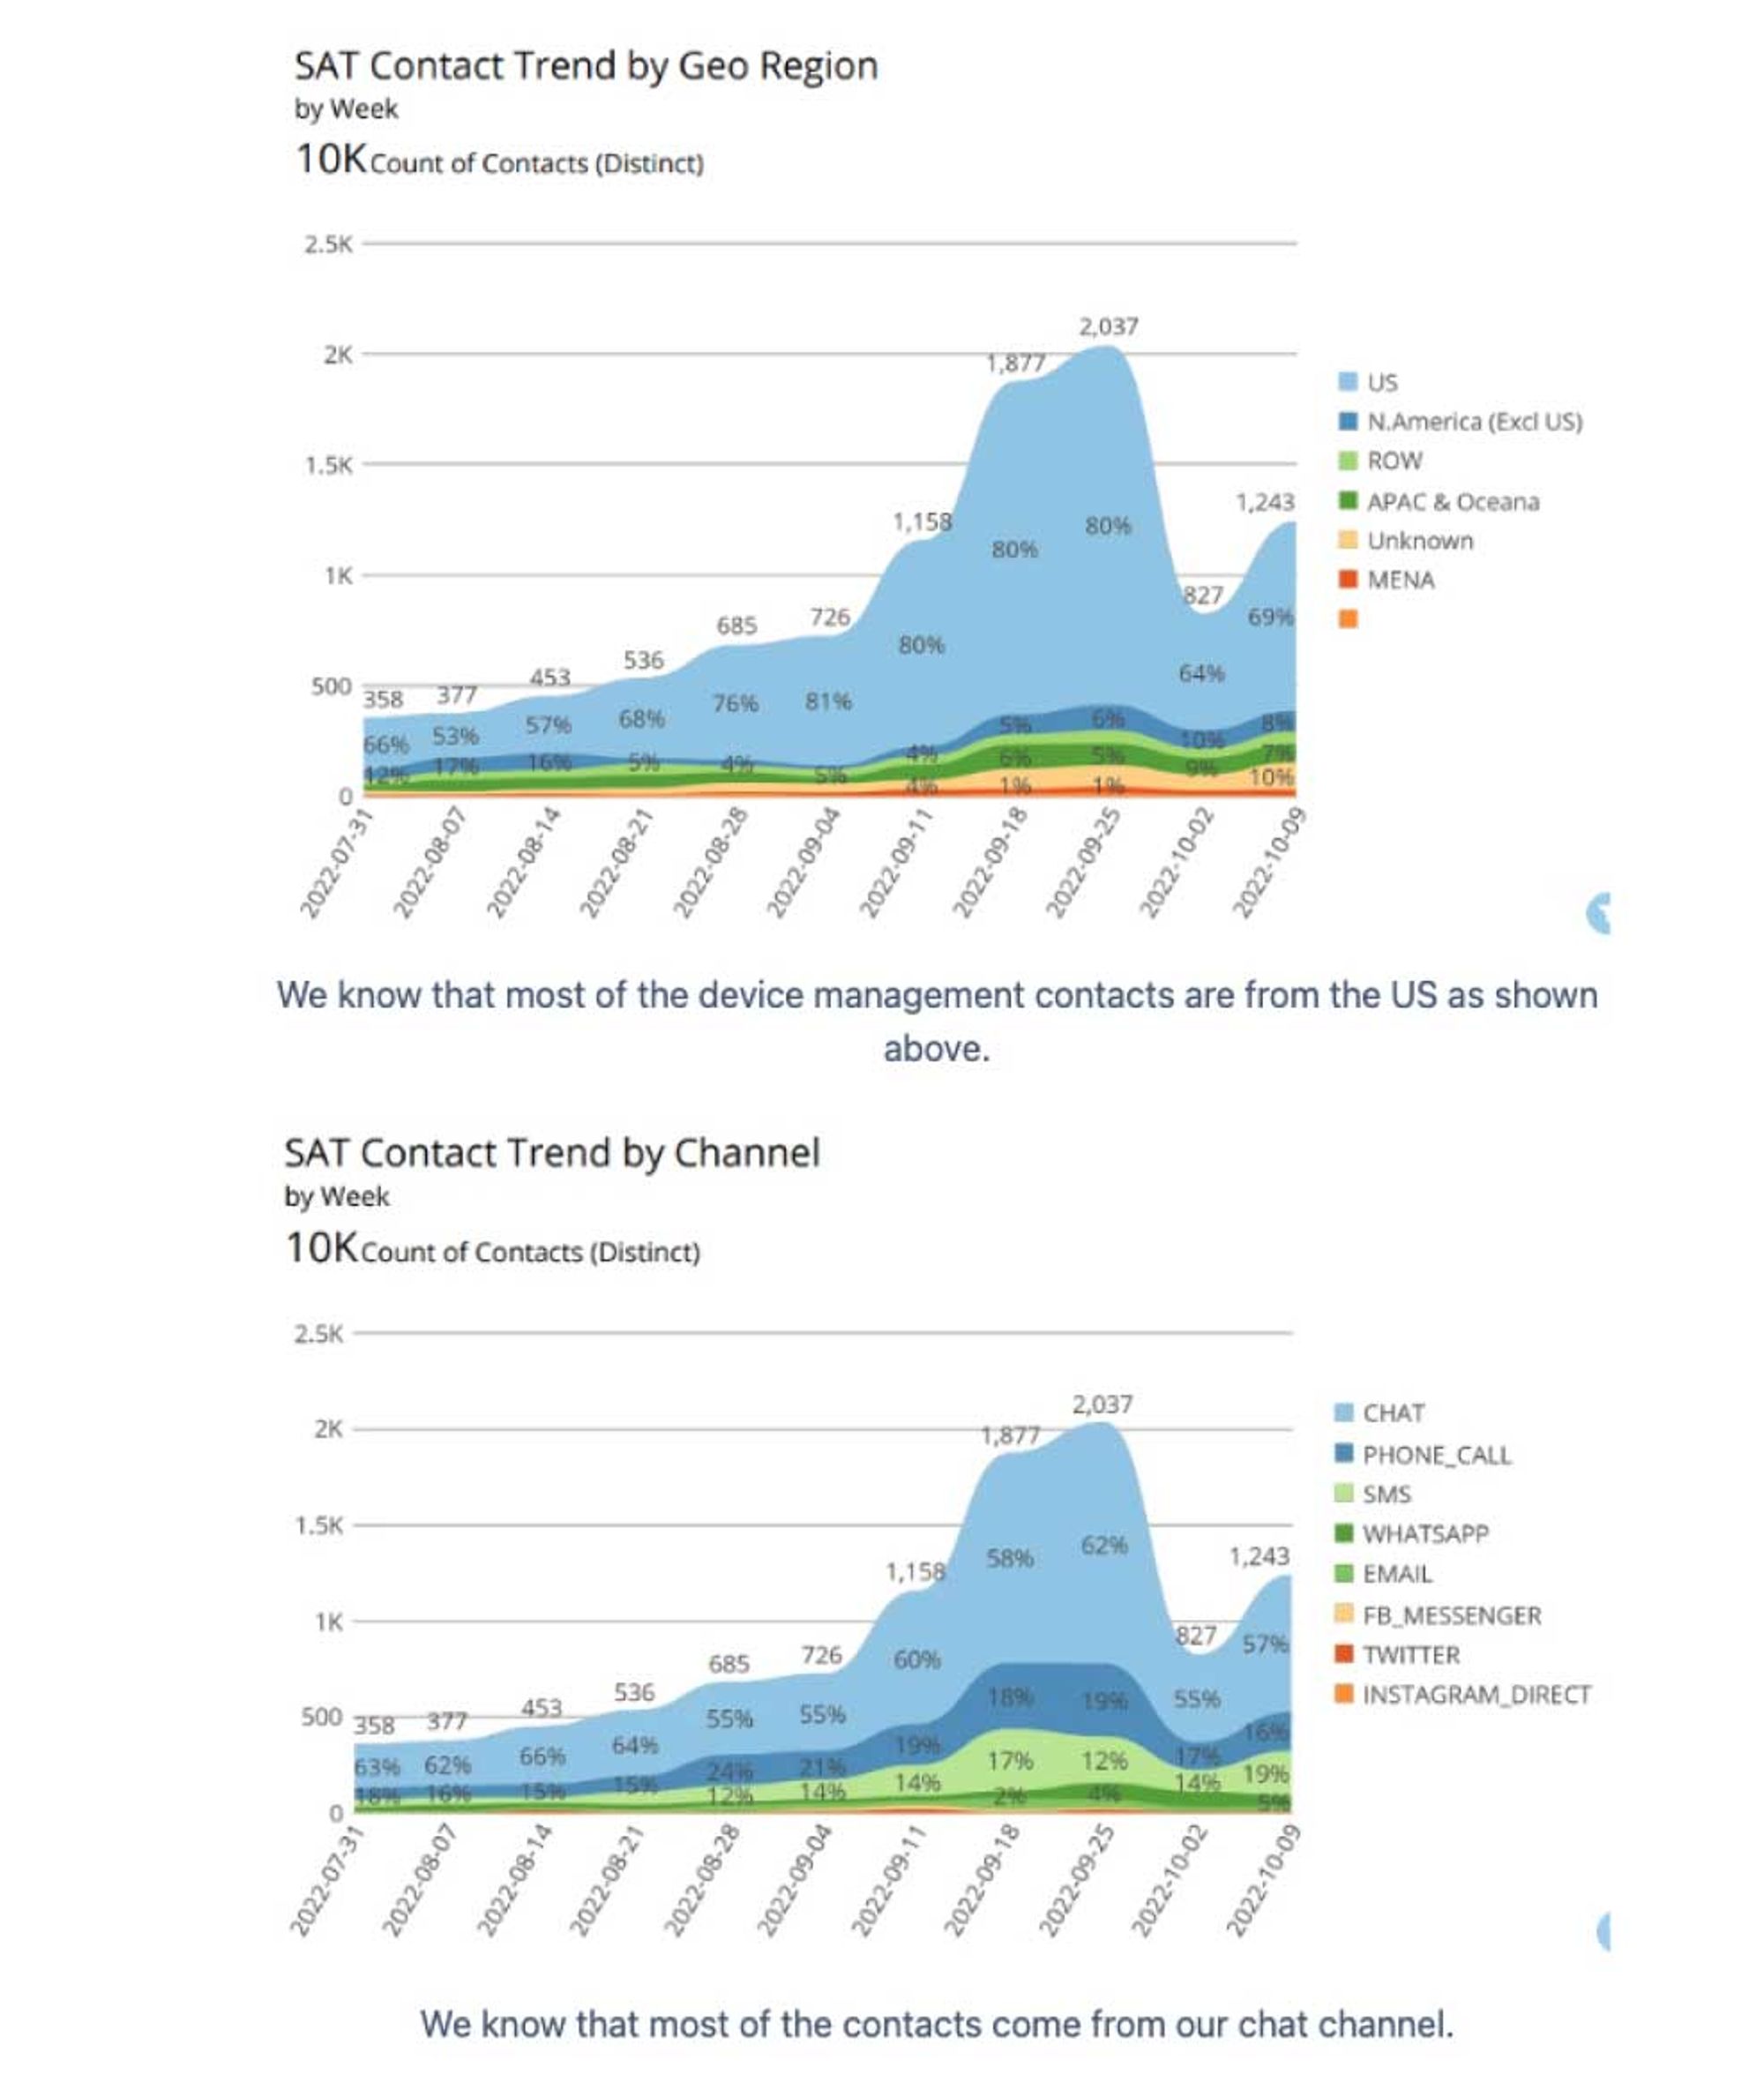
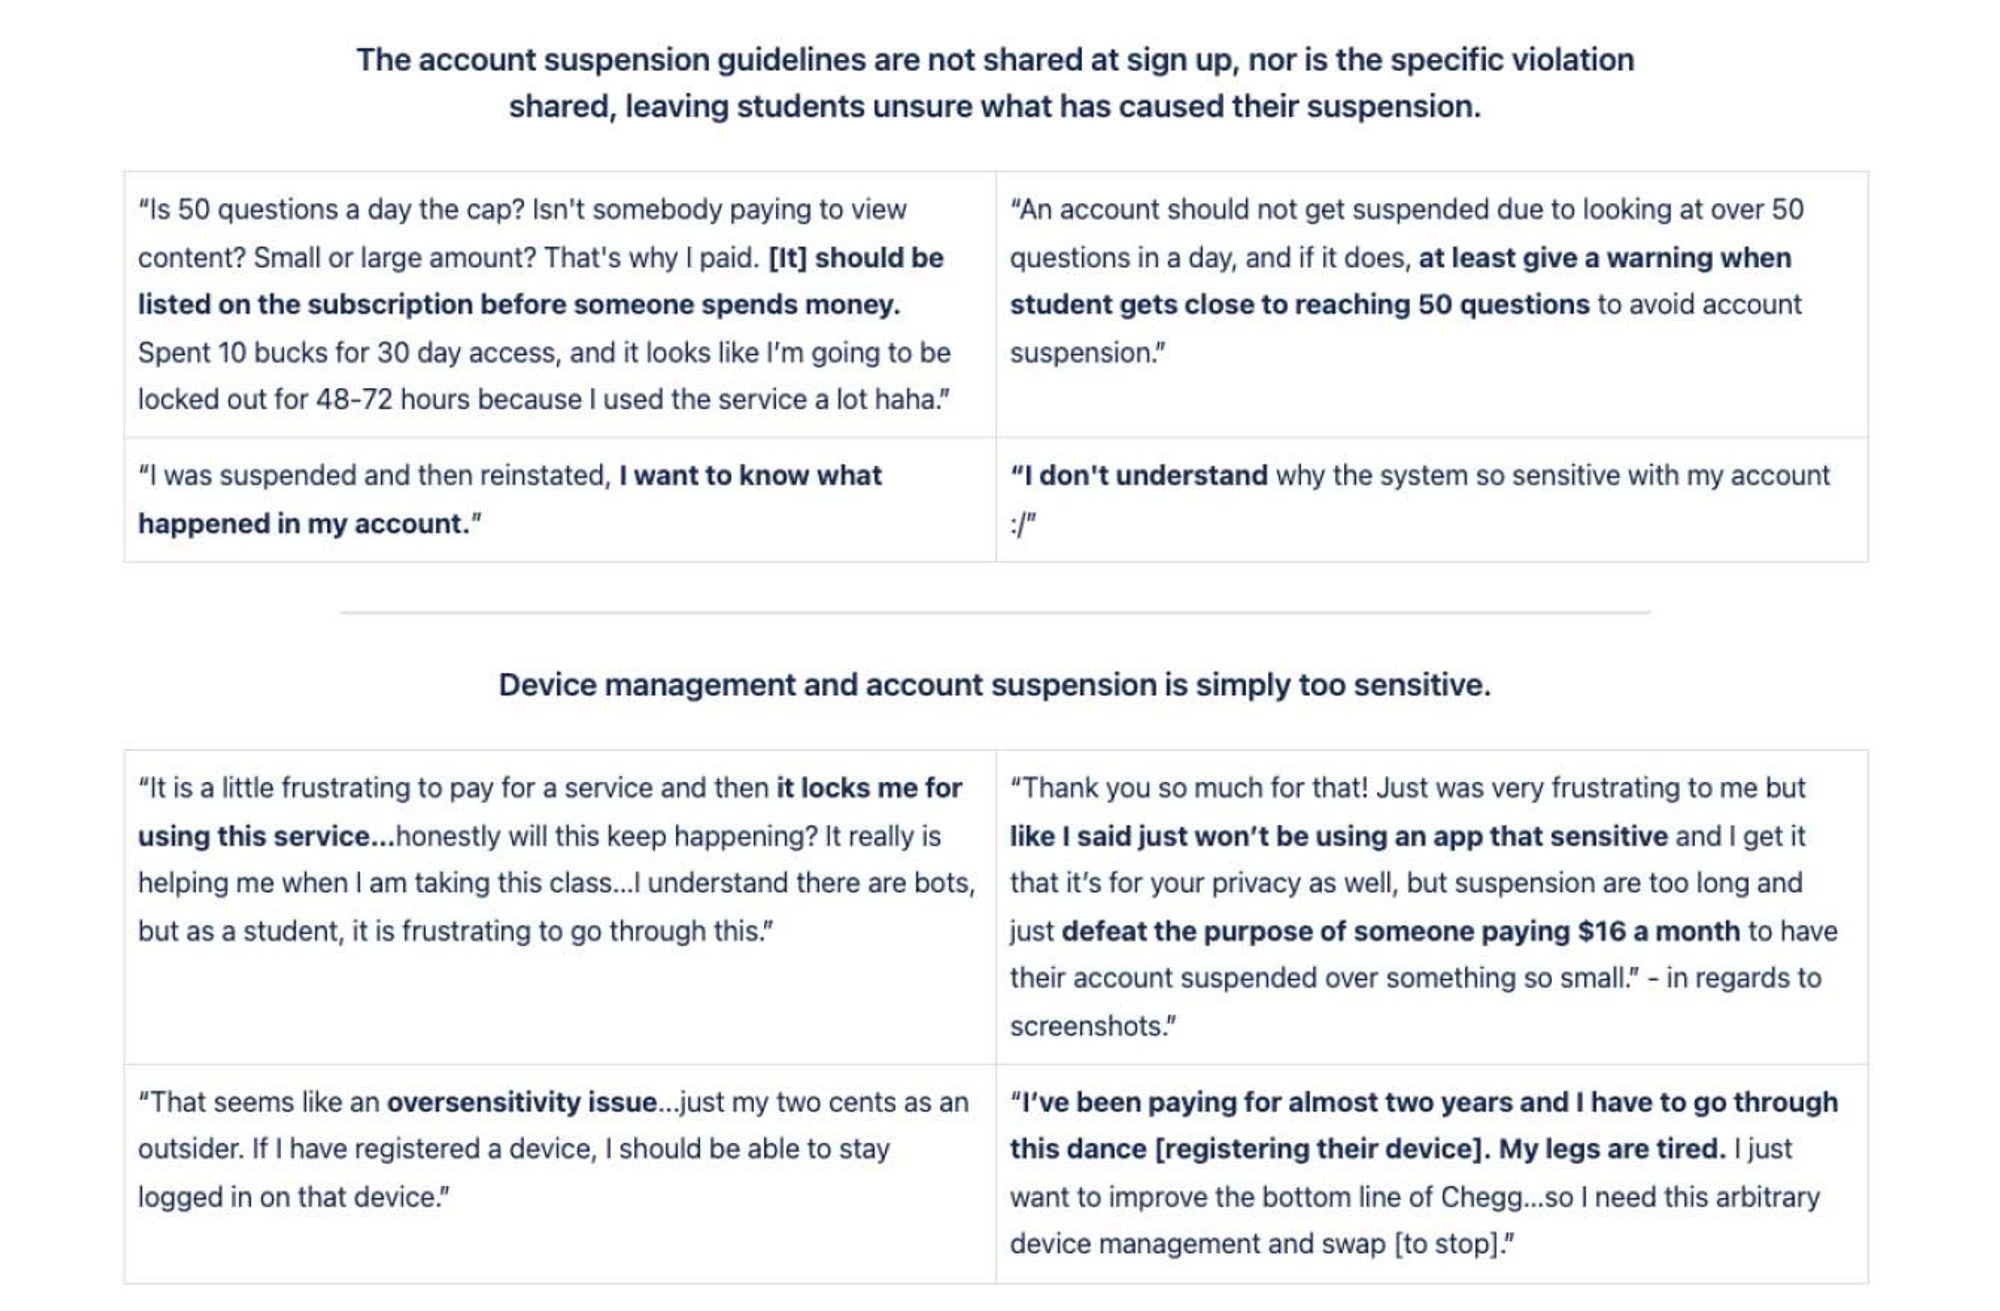
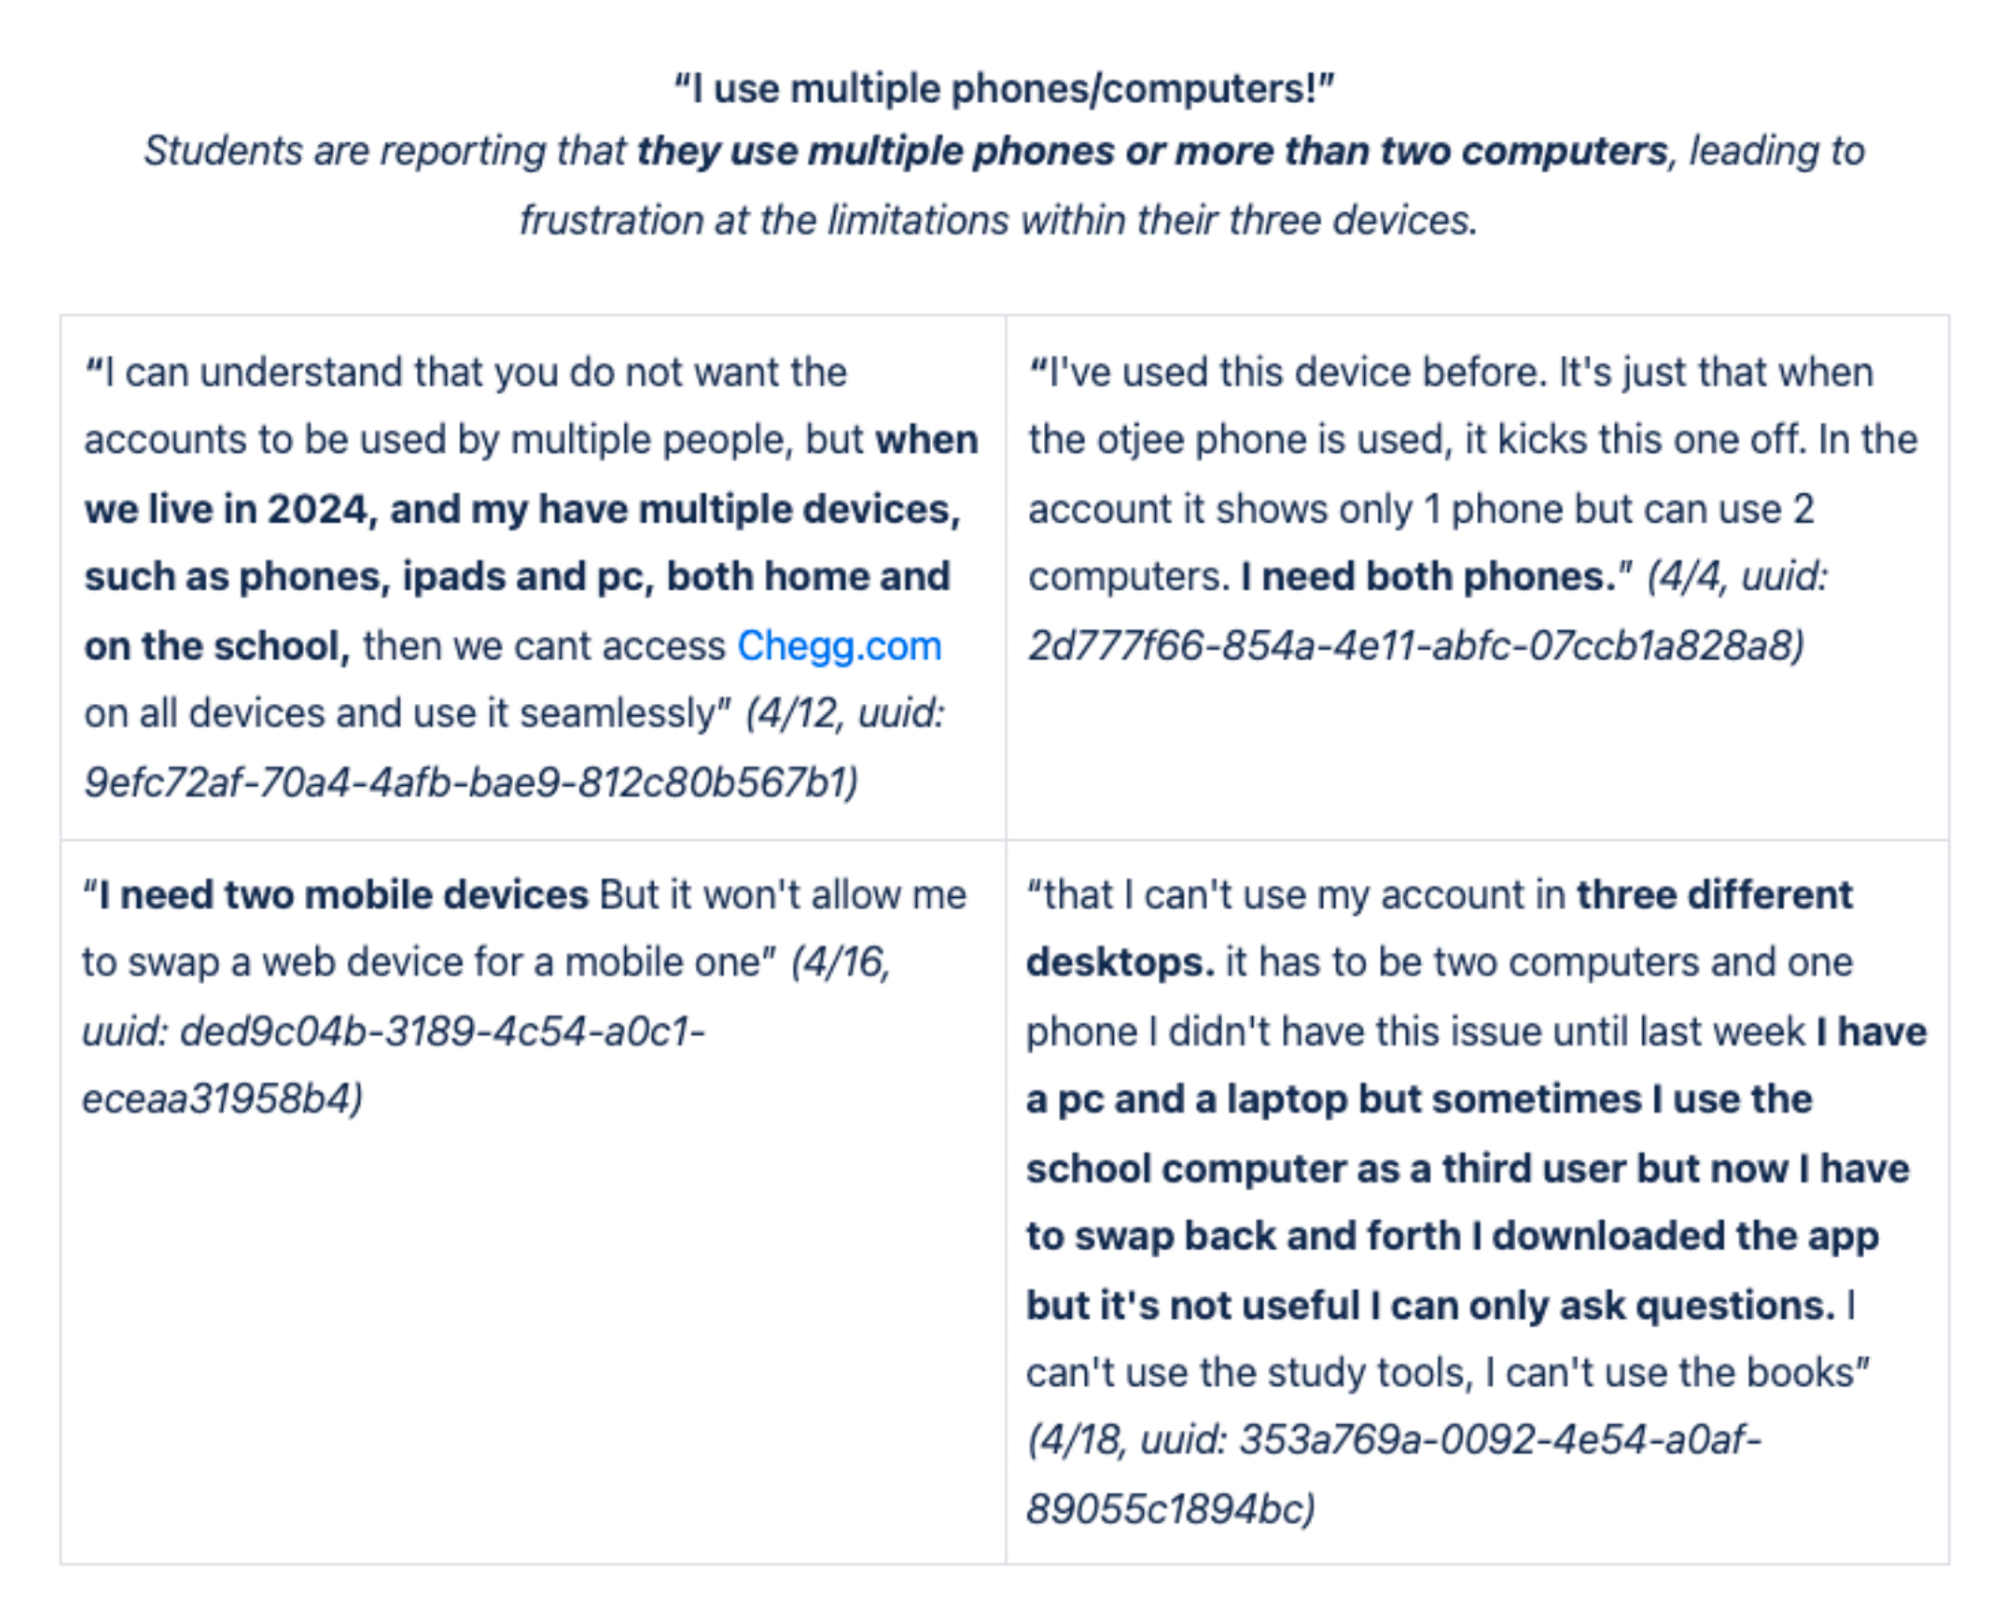
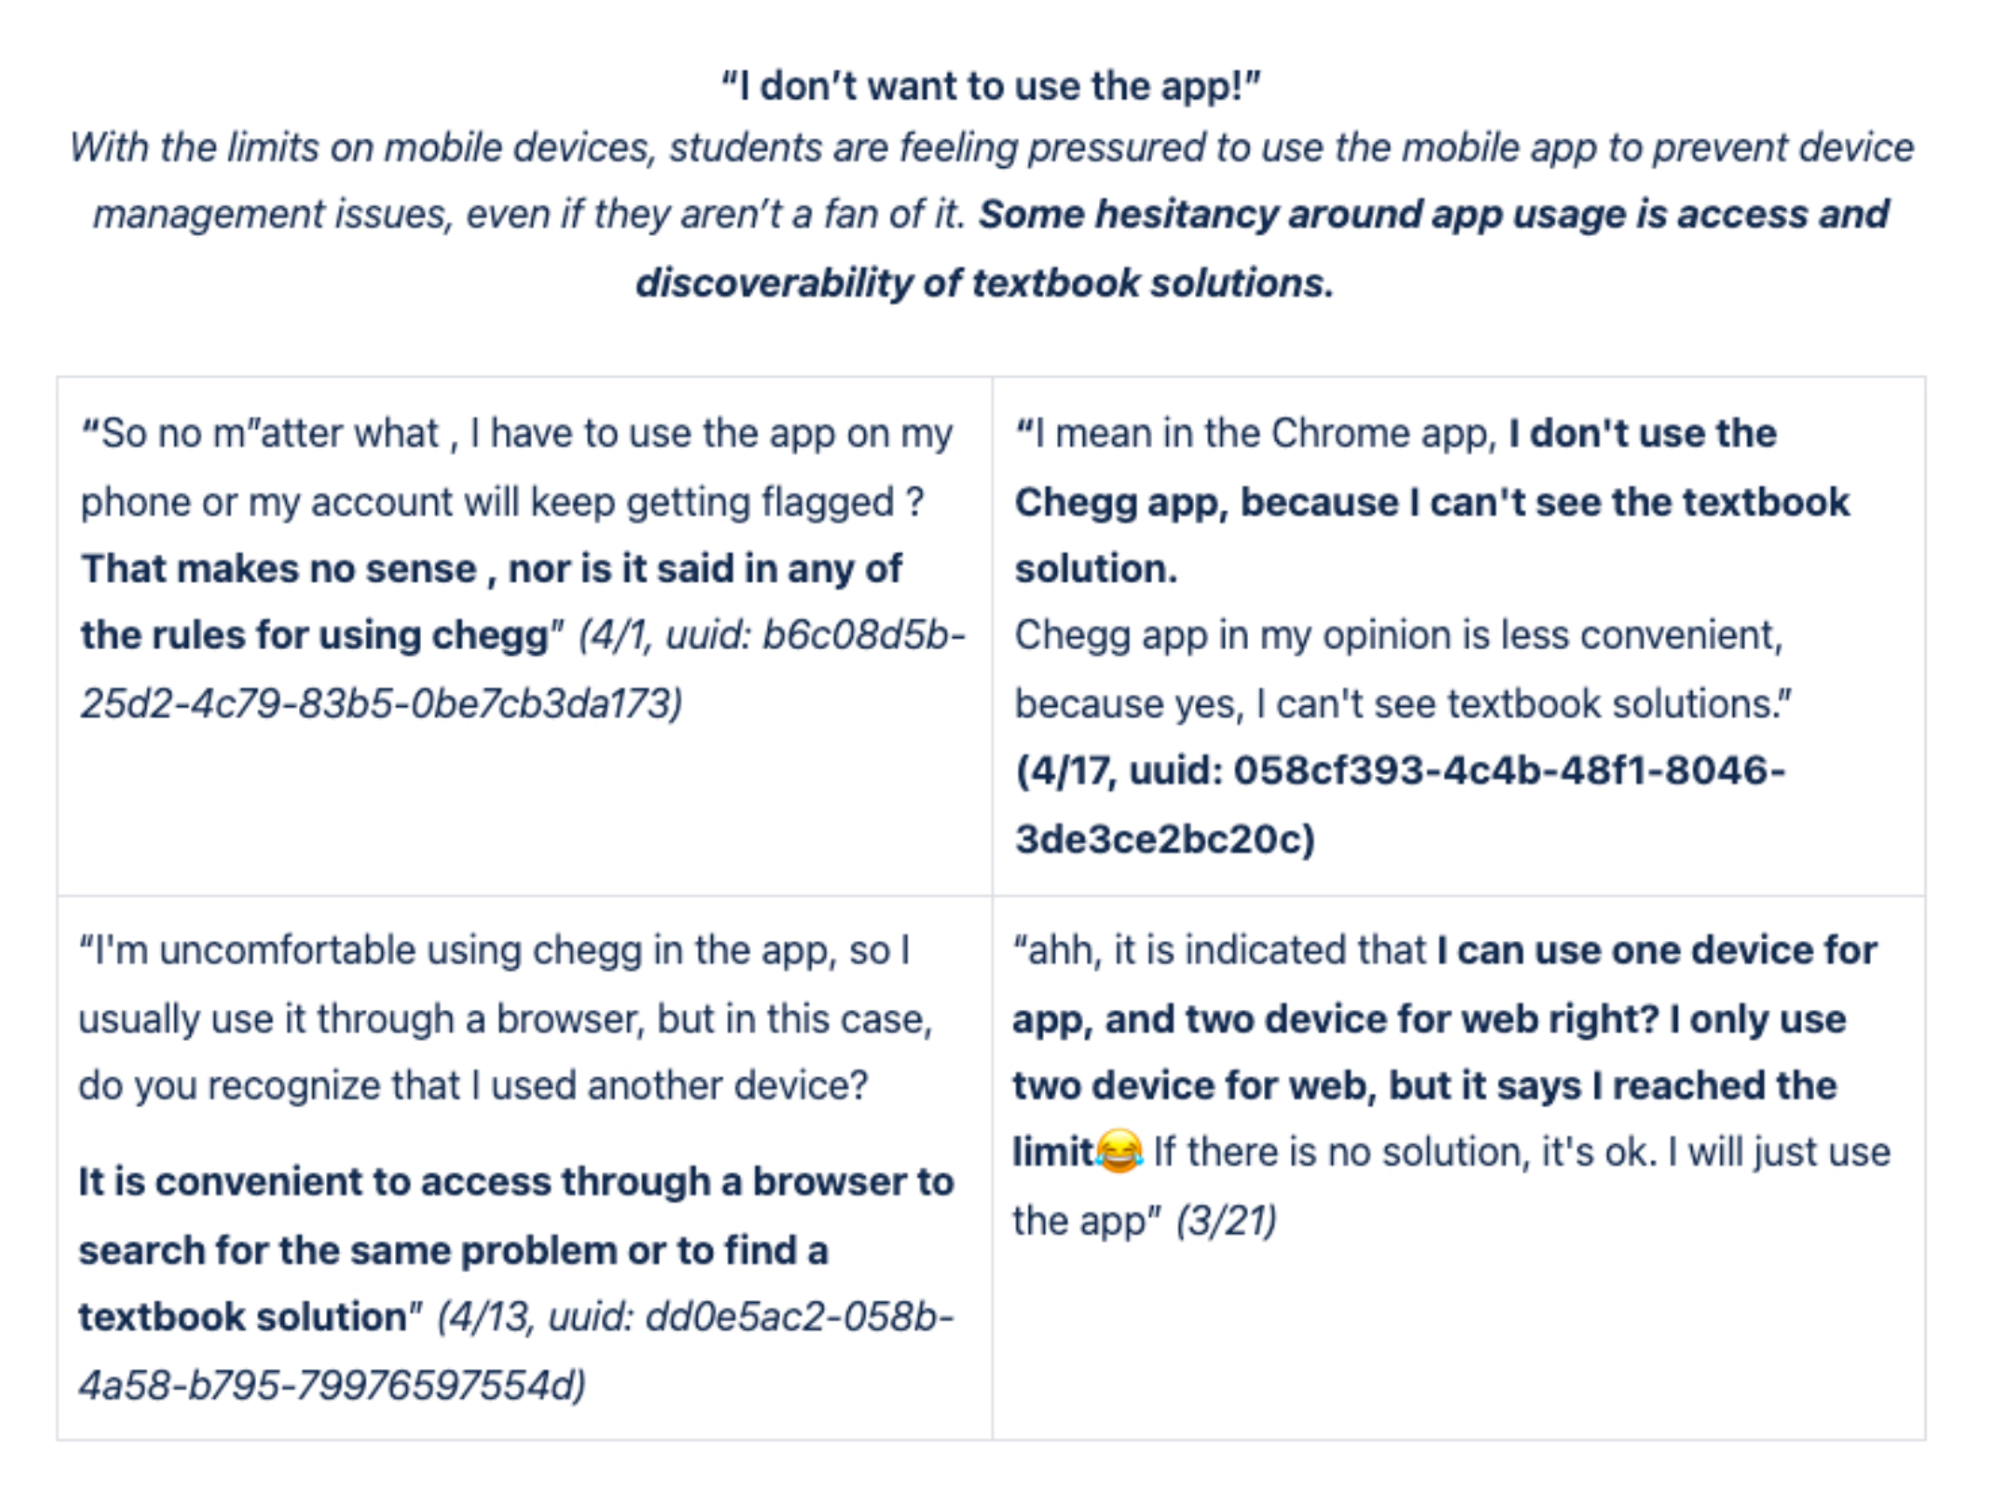
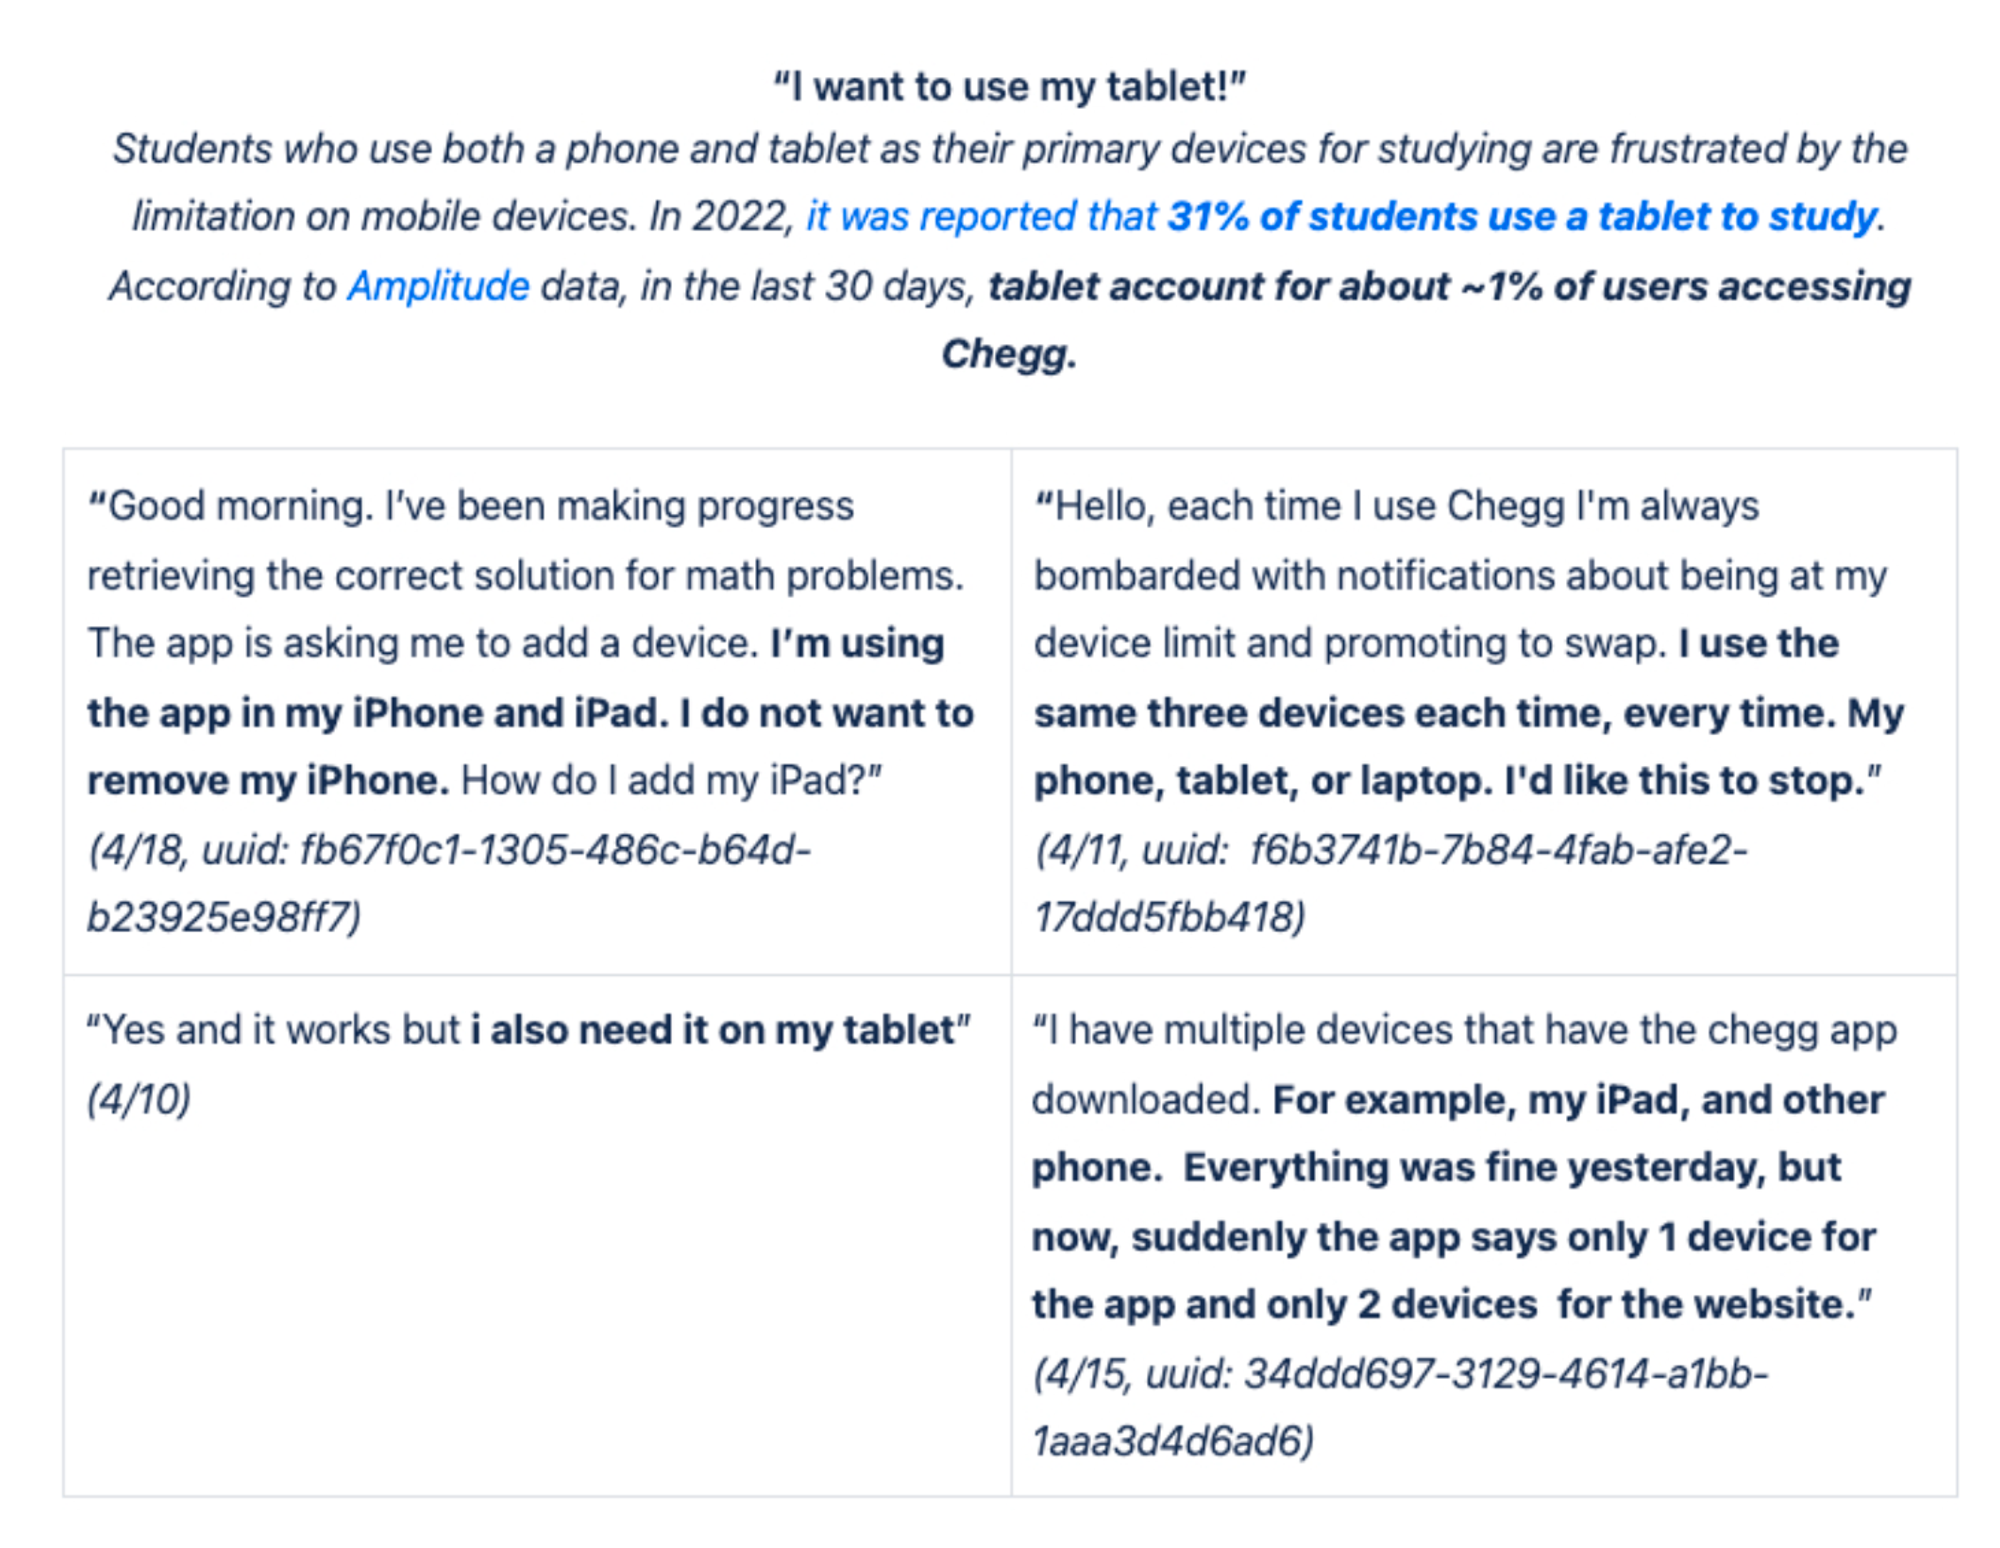
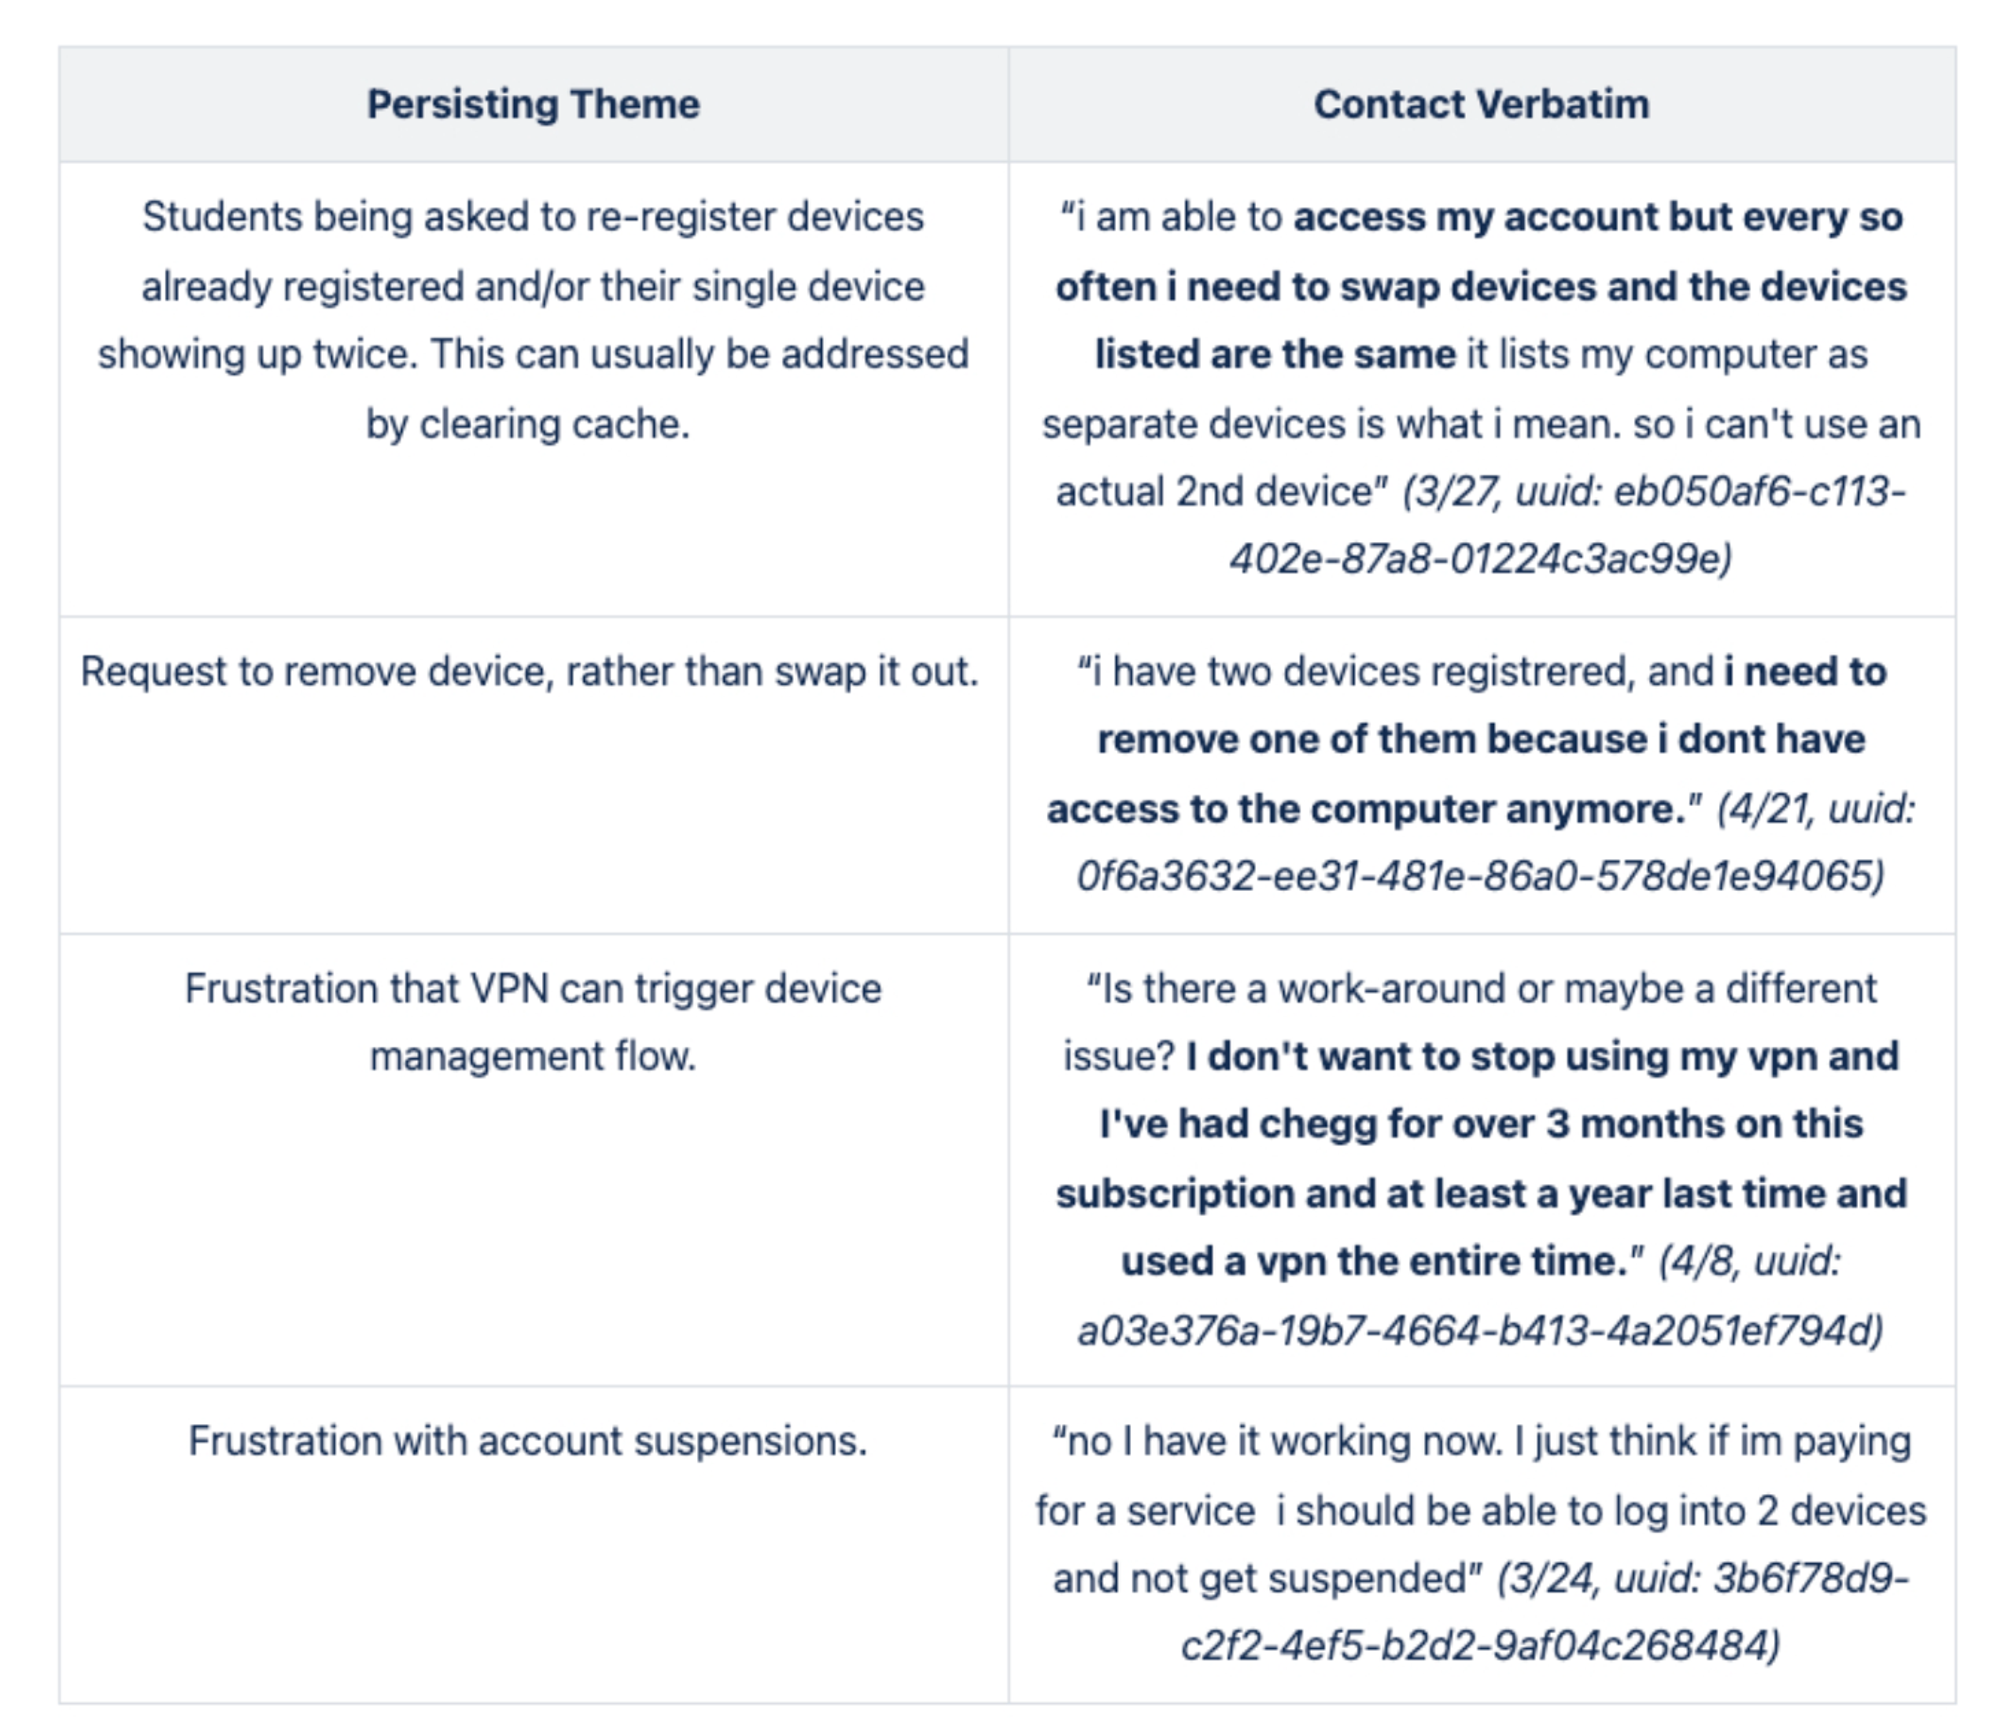
Show More: user data behavior and verbatim customer feedback