
Portfolio Categories: Product Design
Chegg Service Abuse
FINAL PRODUCT
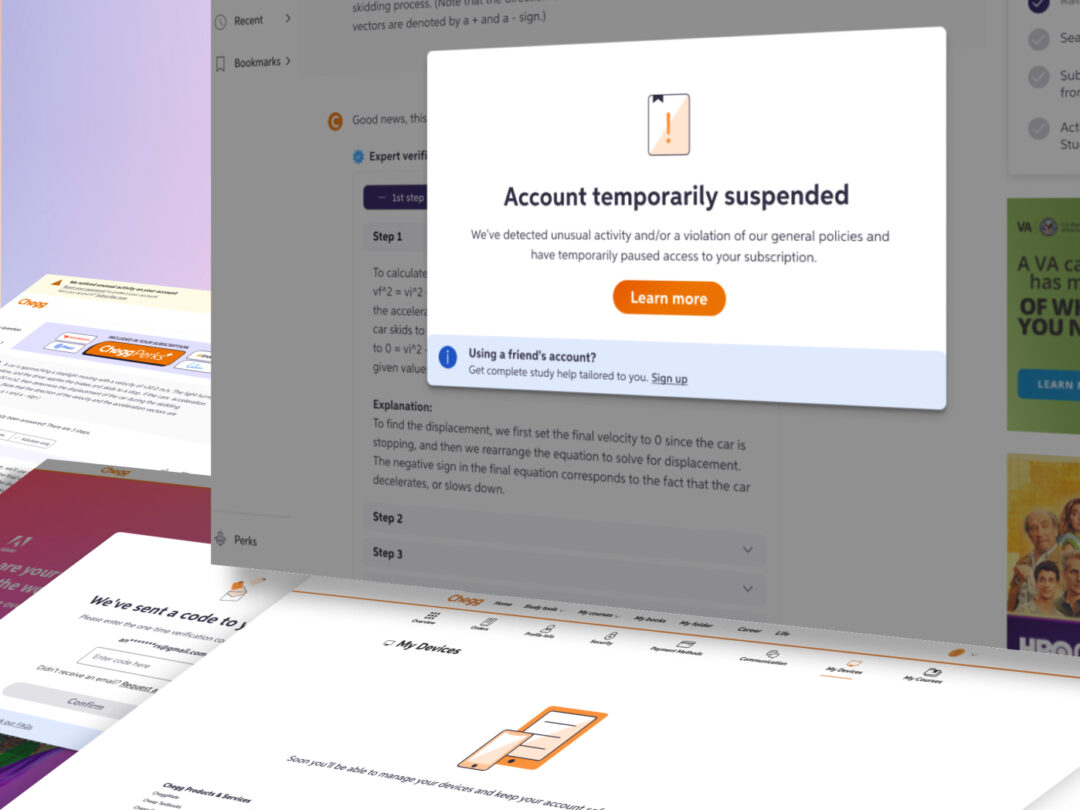
A few examples screens of the Service Abuse initiative ranging from Detention, Device Management and MFA(s).


DISCOVERY PHASE
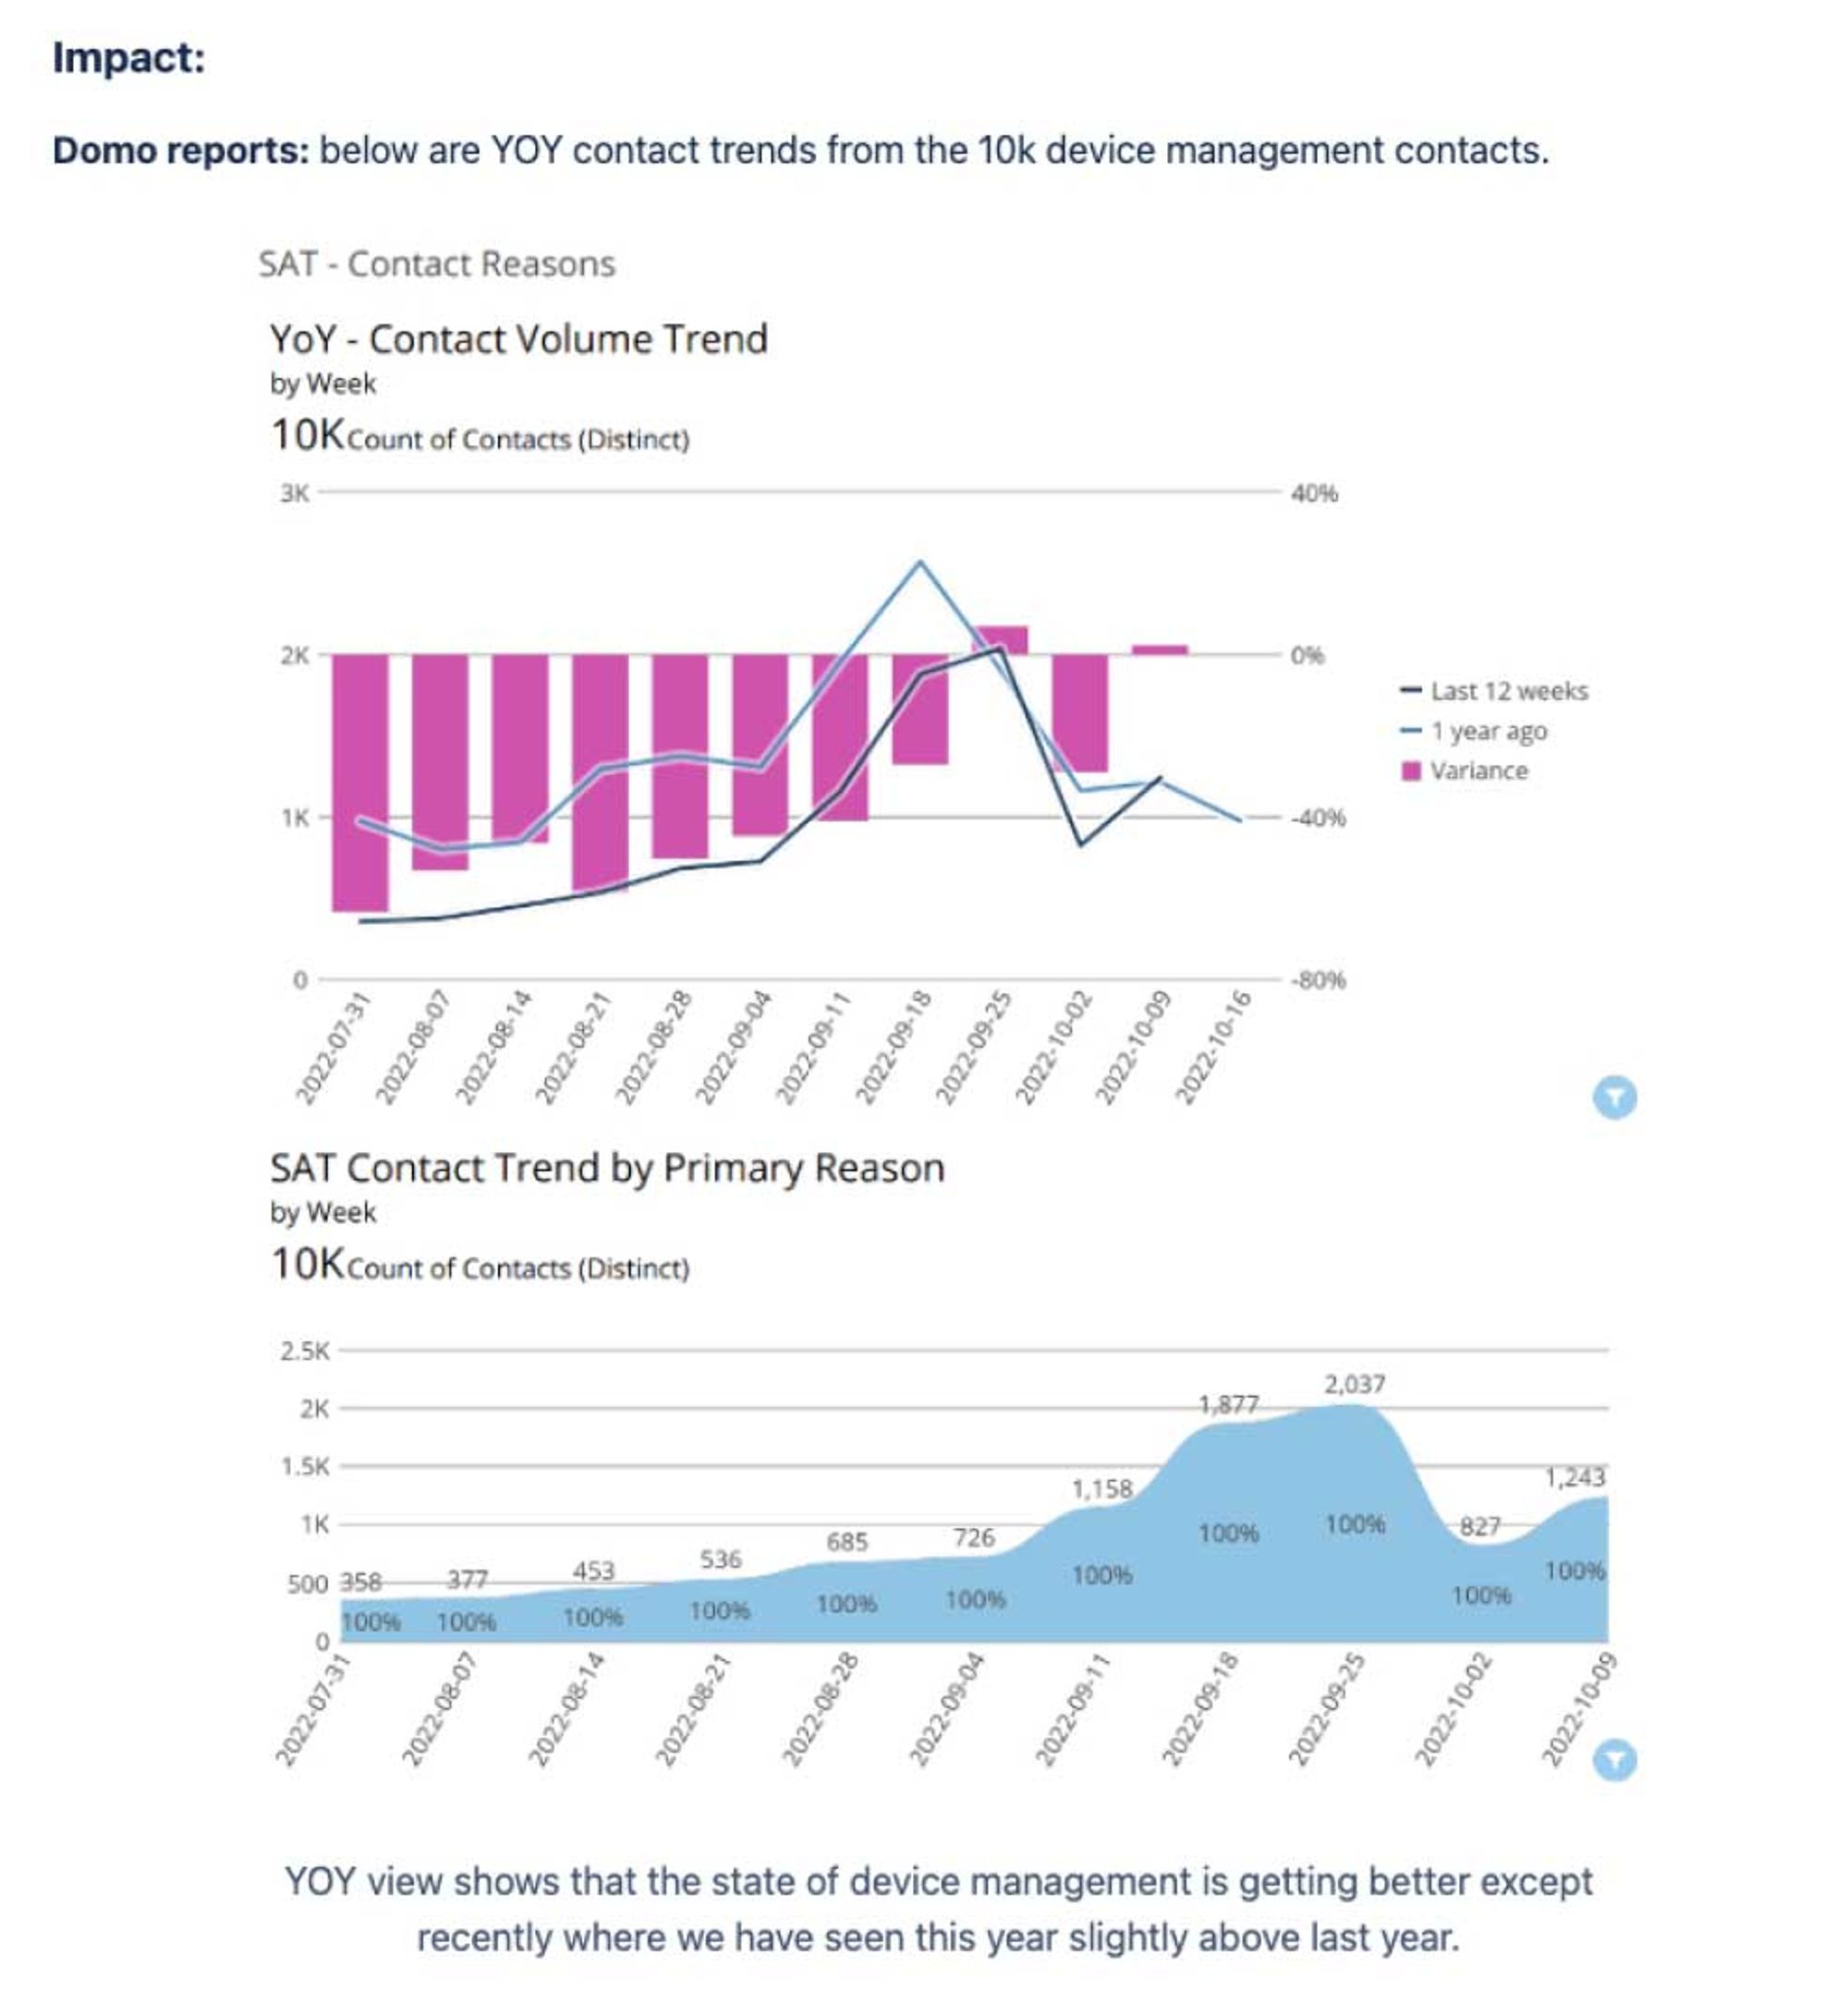
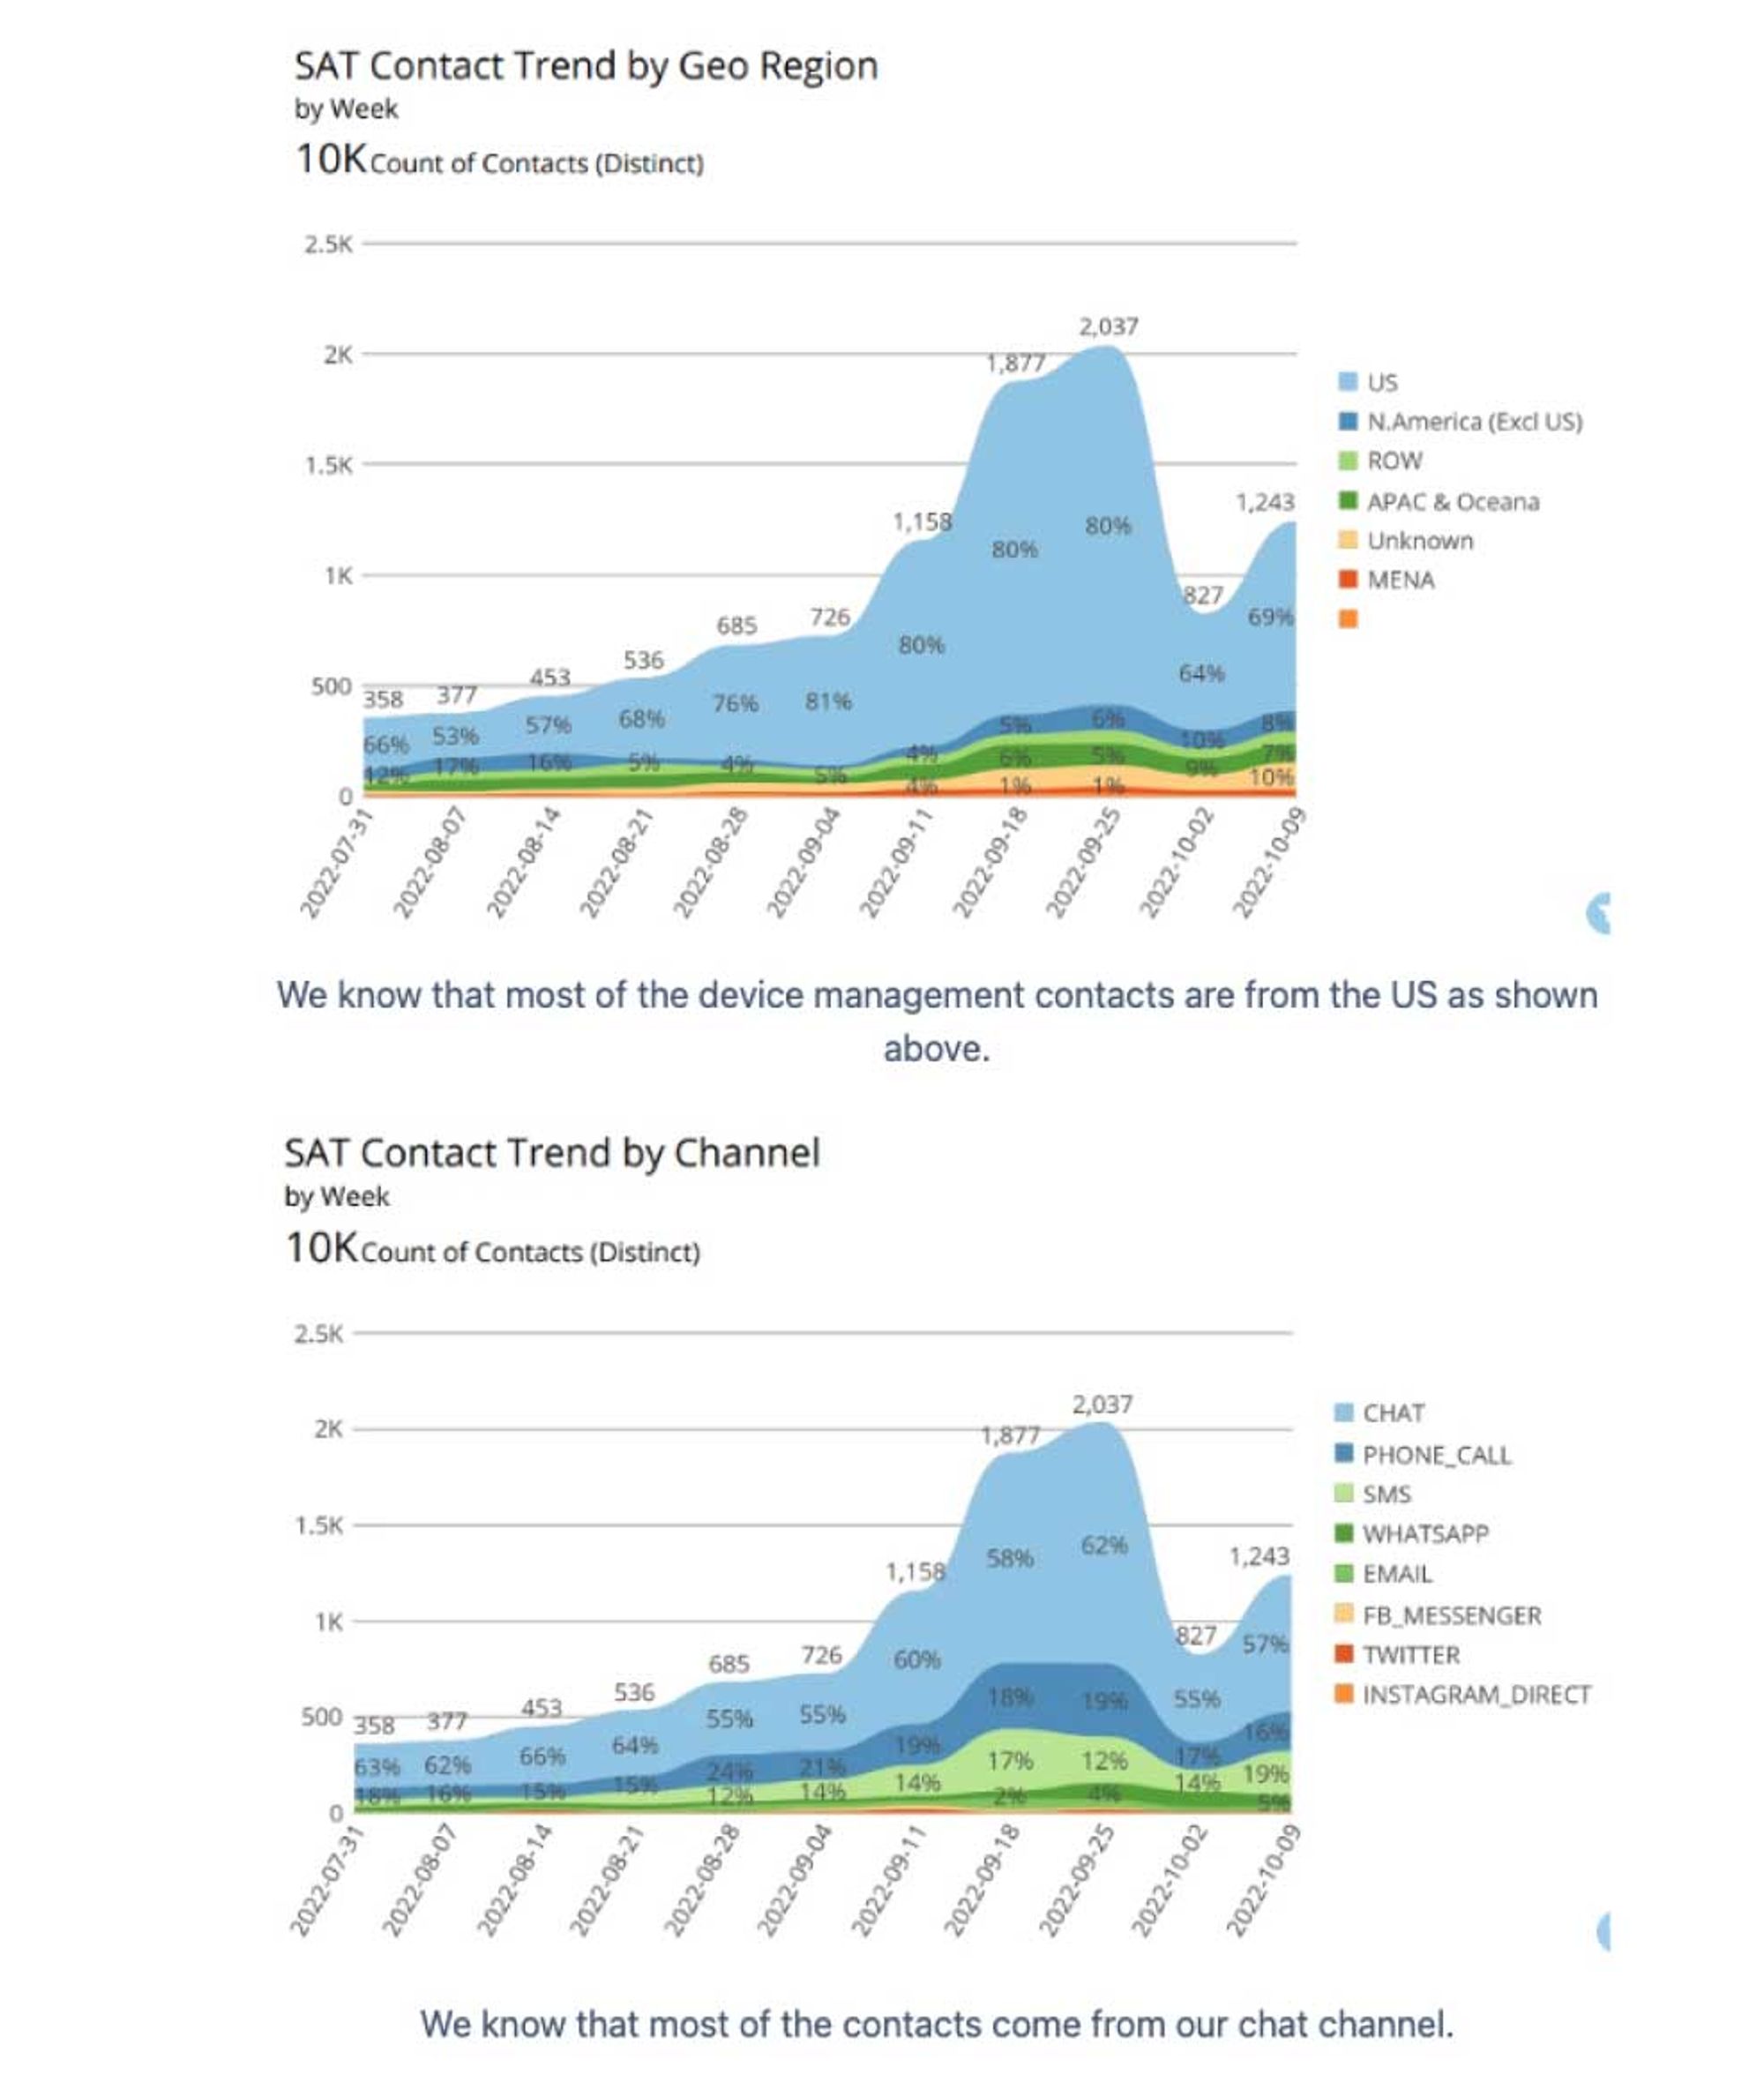
The first step of the Discovery Phase was the understanding and gathering process which began with a lot of quant data deep dive and customer service direct feedback from users. It was important to validate our hypotheses and to understand user sentiment.
Quantitative Data (deep dive into the quant data to try and validate the anomalies hypothesized)
↓

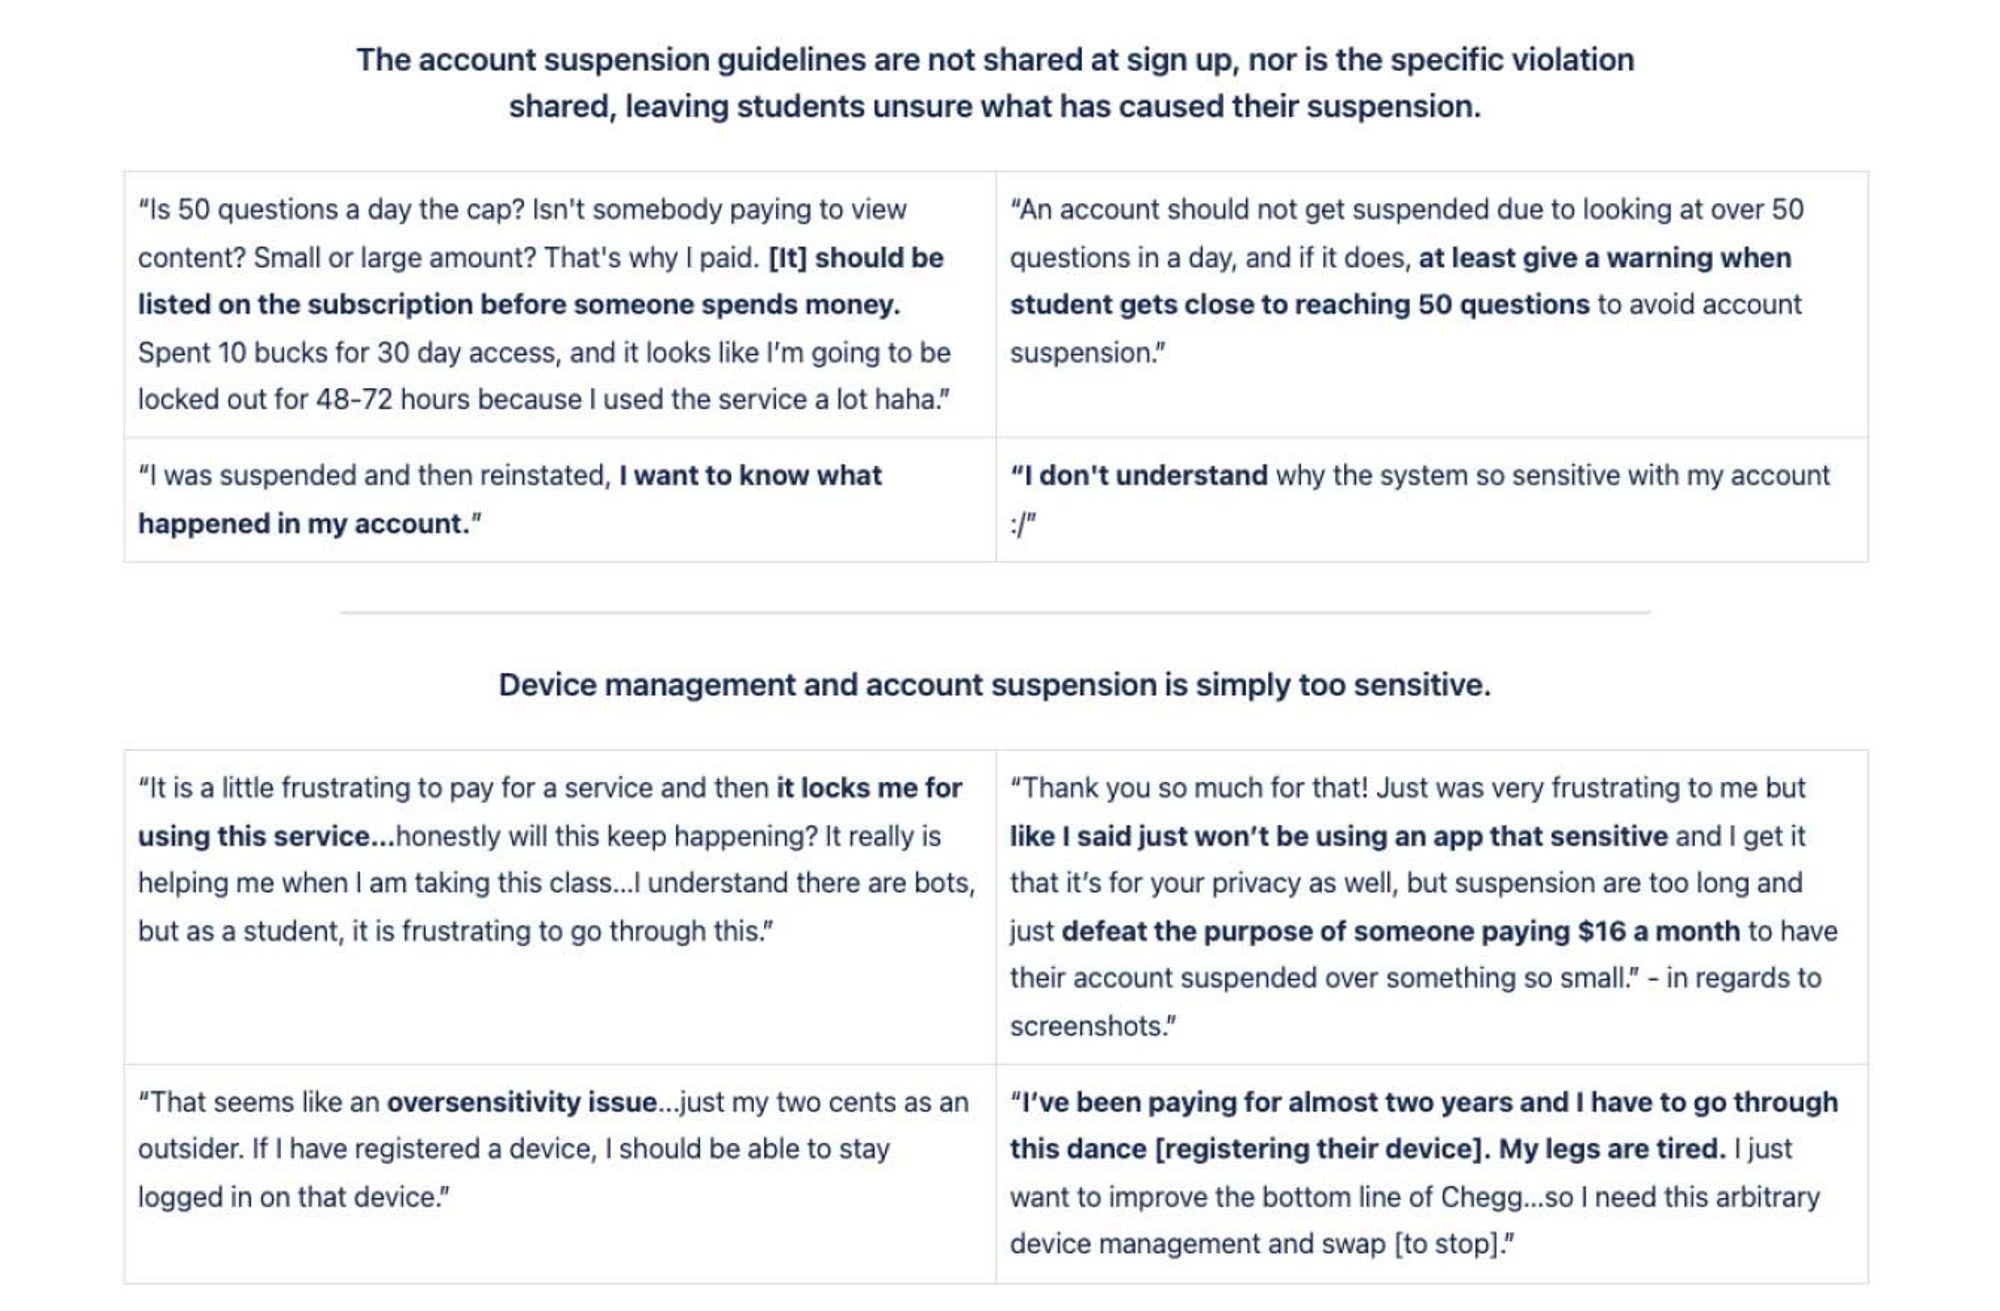
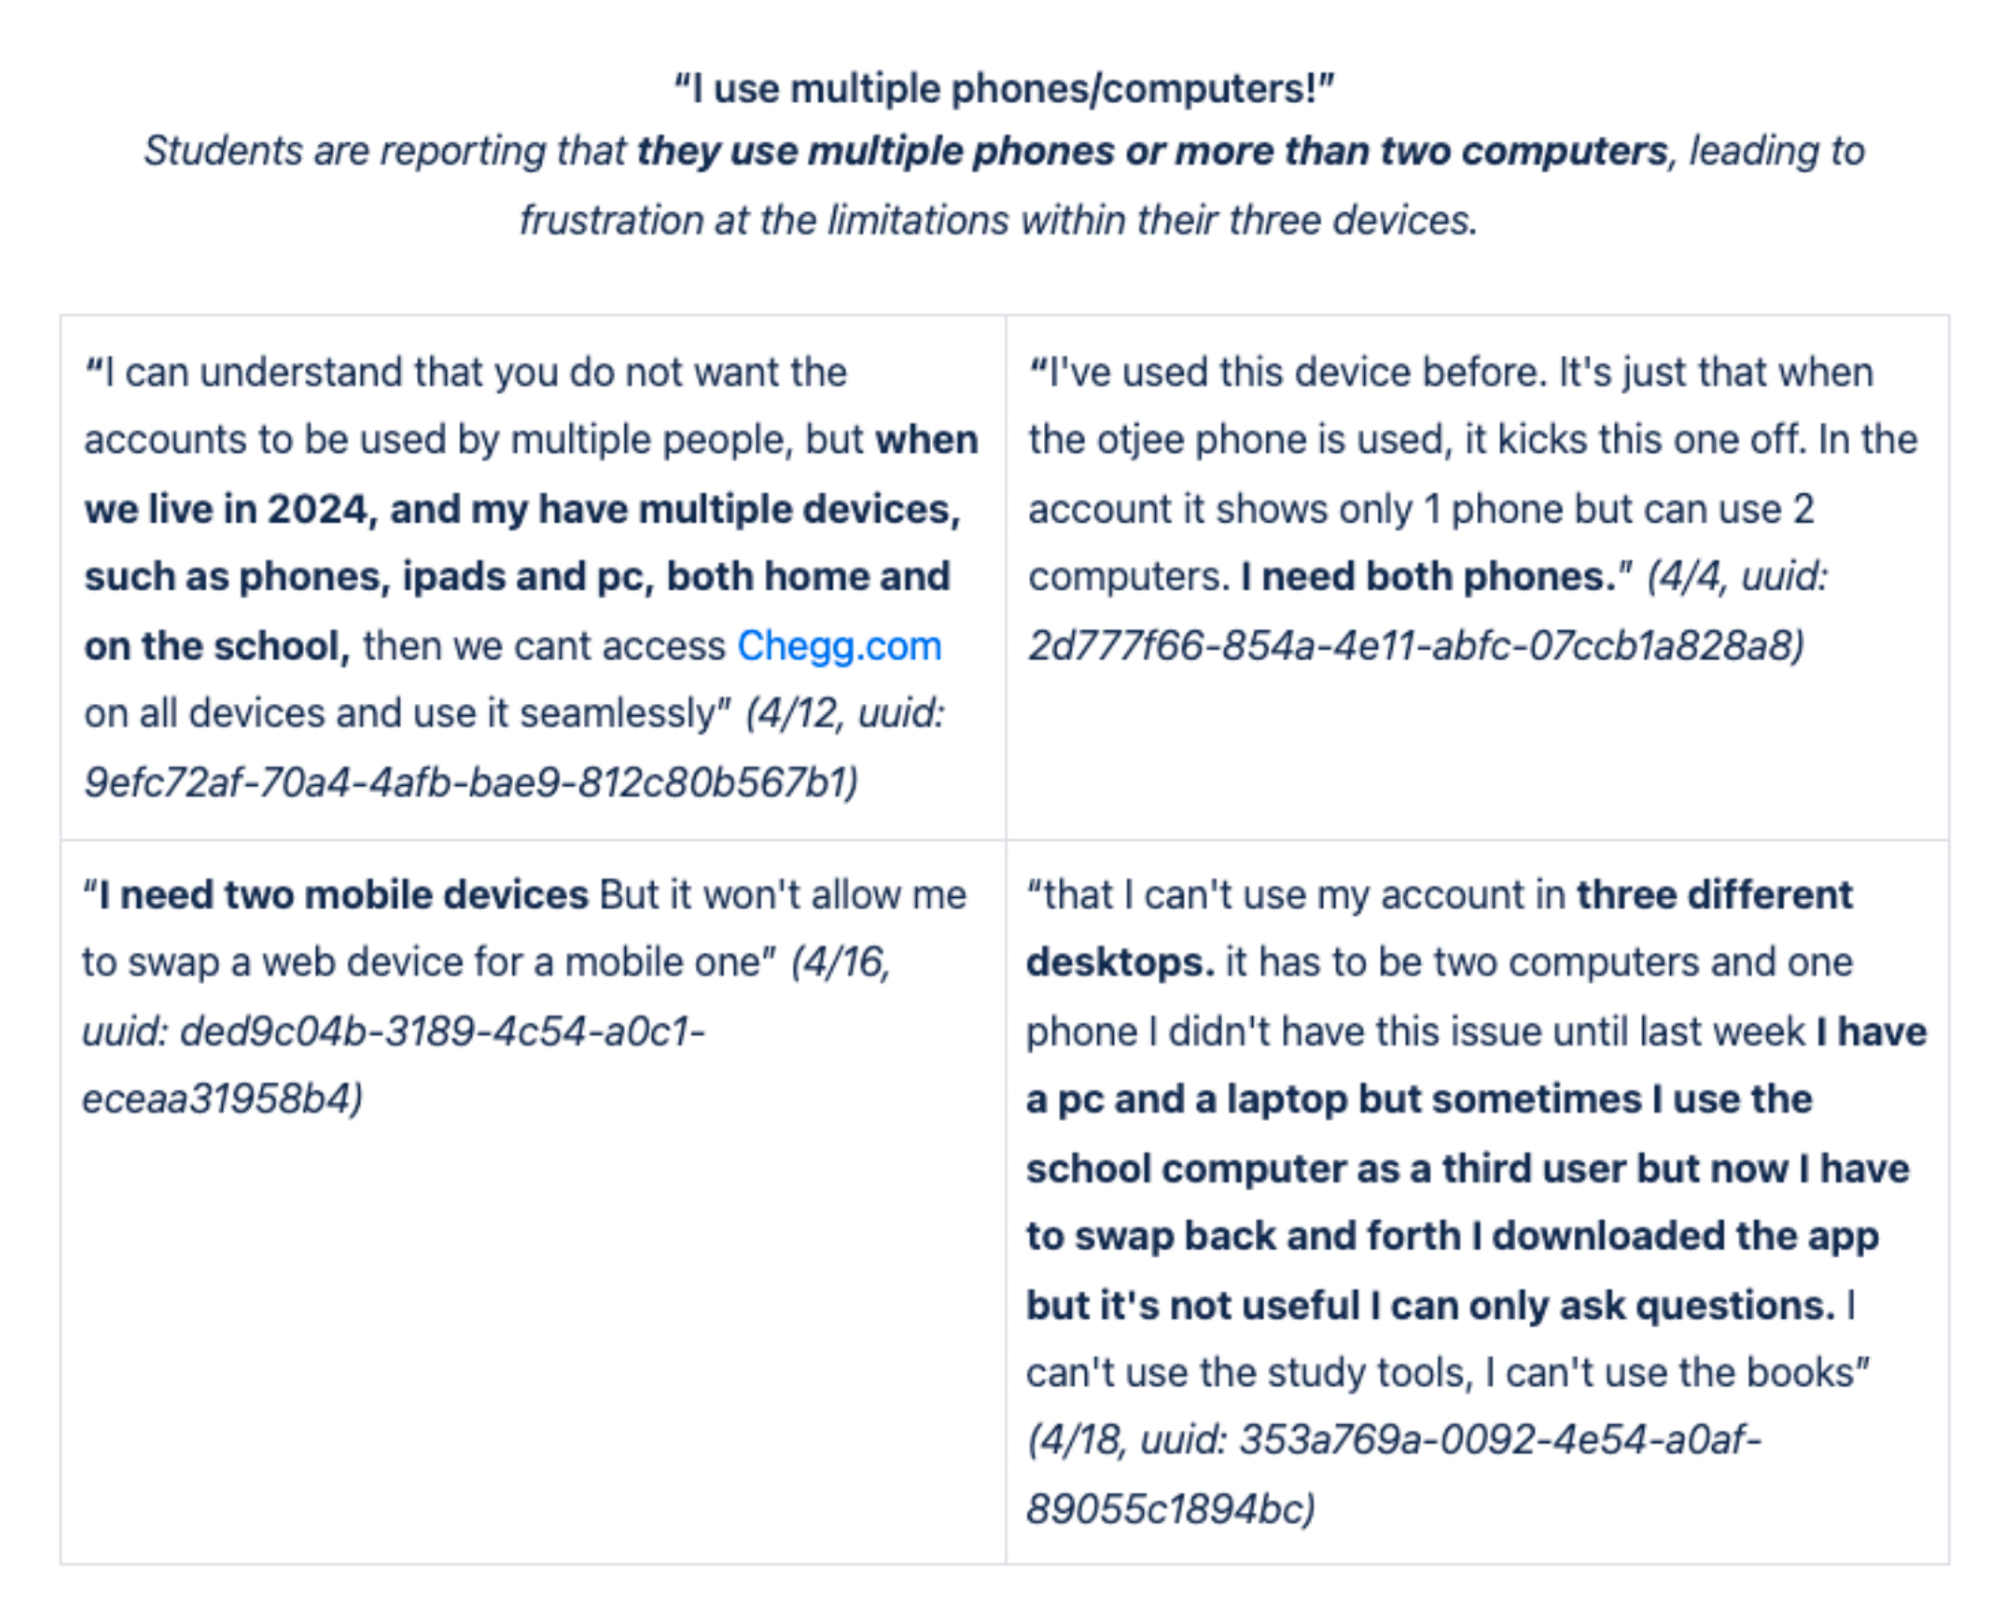
Customer Service Team Insights/User Feedback (collected all the verbal feedback from student advocate interviews, scrubbed through dozens of pages of call/chat logs, interviews, etc)
↓

Research Plan & Outcome (wrote the exploratory research plan and worked with Researcher on execution plan — then shared research outcome with team & stakeholders)
↓


Competitive Analysis Did a robust design/architecture/product competitive analysis of how other products handle account sharing, Device Management and MFA.
↓


IDEATE PHASE
There was an ideation phase for each of the phases of Account Sharing. It consisted of numerous items such as whiteboarding, user flows, wireframes, competitive analysis, high fidelity and prototypes.
Whiteboarding First thing I did was get in a room with the PM and lead architect on the project and we white boarded all the use cases and talked through any constraints or dependencies
↓

Eng Flows (following white boarding sessions, I created engineering flows to break down and understand the logic further. This part is particularly important for me because platform logic tends to be extremely complicated and nuanced. Below are examples of device management and MFA via app)
↓


Wireframes (I then went through multiple low fidelity wireframes which I shared with the team often and early to solicit feedback and get alignment)
↓

High Fidelity (once we locked the UX in low fidelity mode, I moved on to high fidelity designs where the focus was more on design systems & Chegg-UI components with rapid feedback and iteration sessions)
↓


Prototype & User Testing (after locking on the direction and final UI, I put together some prototypes in Framer which we put in front of users, both in moderated testing as well as unmoderated testing to get more signals)
↓


REFINE PHASE
After refining the UX in wireframes and putting all the UIs into high fidelity designs, I then garnered feedback internally (with immediate product team, stakeholders and design critiques) and made final revisions for handoffs. This included a last round of feedback from content design and legal to prep for our UXQA and dogfooding sessions.
Internal Feedback (final stakeholder steering committee shareout for feedback with Figjam)
↓

Final Design Revisions (some example final designs)
↓


RESPONSIBILITIES
- Research (wrote initial exploration research plan and worked with Researcher for qual sessions)
- UX
- UI
- Interaction
WHAT IS IT?
Chegg faced a growing issue of service abuse, where users shared accounts, resold access, or exploited security vulnerabilities, leading to revenue loss and customer dissatisfaction. This not only undermined the platform’s business model but also eroded trust, as legitimate users faced account takeovers, interruptions, and security concerns. The challenge was to implement effective deterrents without creating excessive friction for paying customers.
WHAT IS THE PROBLEM?
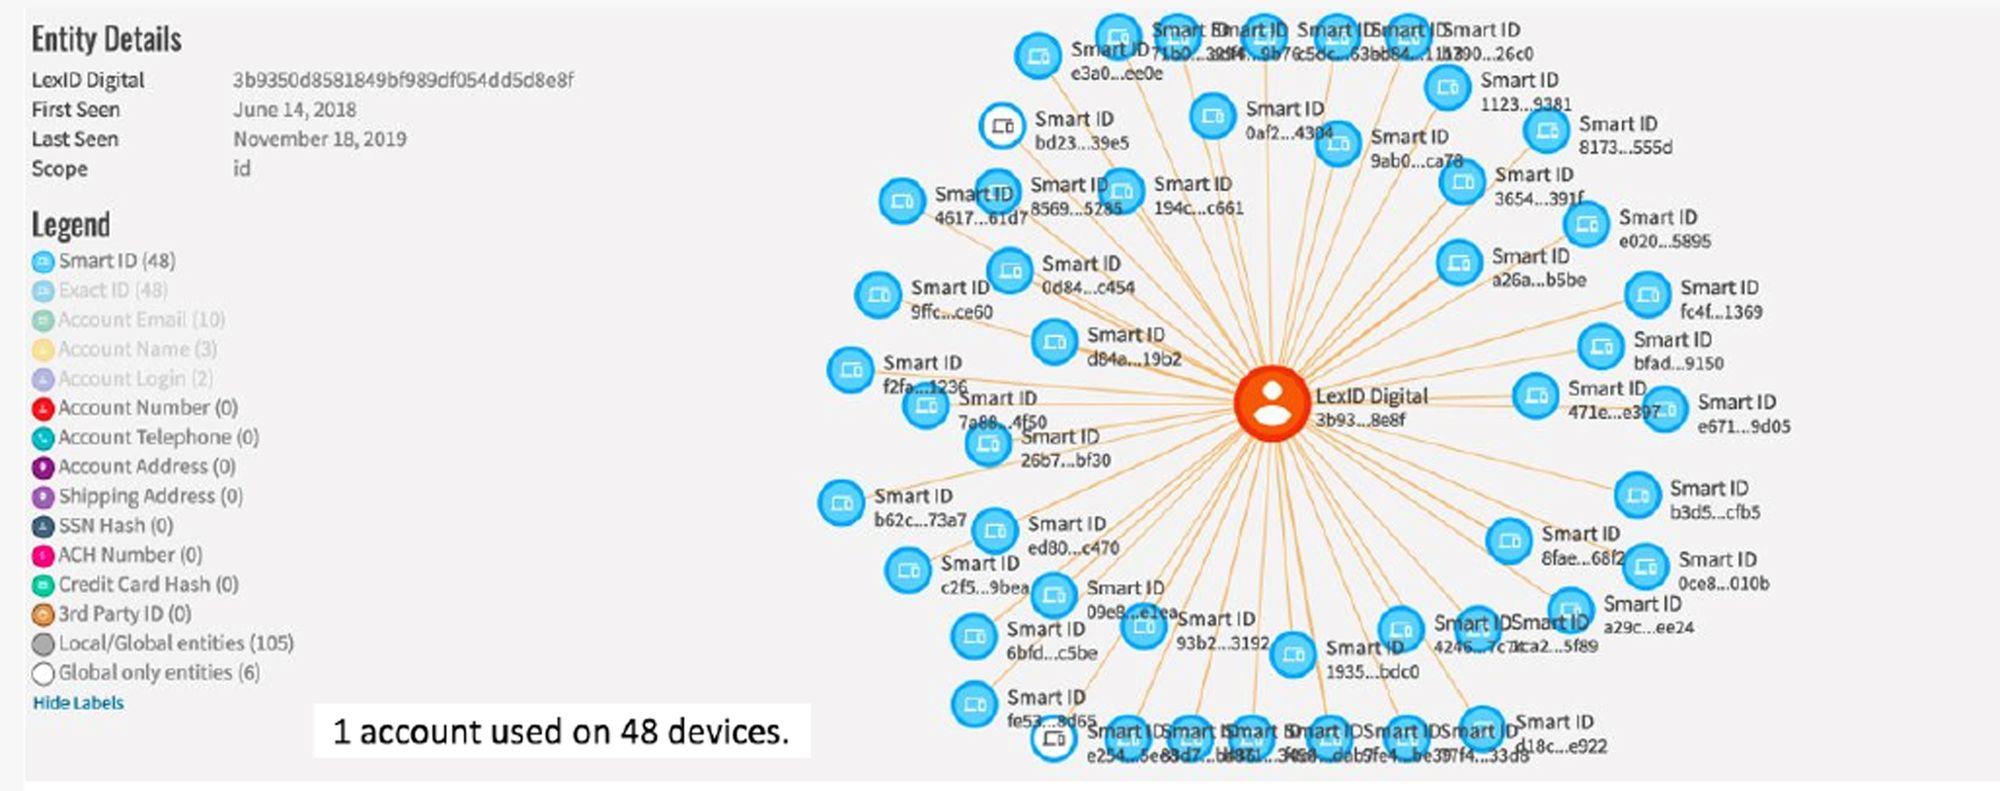
Chegg’s platform was losing revenue and user trust due to unchecked service abuse, primarily through account sharing, credential theft, and content reselling. Over 60% of users engaged in some form of unauthorized access, and a single account was found linked to 48 devices.
This not only devalued subscriptions but also led to a surge in customer complaints, with 17% of support calls related to account takeovers. The challenge was exacerbated by the perception that sharing was harmless, forcing Chegg to find a way to curb abuse without alienating users or adding excessive friction to legitimate access.
WHAT IS THE CHALLENGE?
The challenge was to curb service abuse, rampant account sharing, credential theft, and content reselling without damaging the user experience or driving away legitimate customers. Many users saw sharing as normal or justified, making strict enforcement risky for retention. Security measures needed to be effective yet seamless, balancing fraud prevention with accessibility. Additionally, any solution had to be scalable, adaptable to evolving abuse tactics, and aligned with Chegg’s business goals of increasing subscriptions and improving customer satisfaction.
Show More: Additional ChallengesWHAT IS THE GOAL?
- Reduce service abuse by curbing unauthorized account sharing, credential theft, and content reselling.
- Protect legitimate users from account takeovers and security vulnerabilities.
- Improve platform security without adding excessive friction to the user experience.
- Increase subscriber growth by converting unauthorized users into paying customers.
- Enhance customer trust and satisfaction through better security and account control.
WHAT IS OUR METRIC FOR SUCCESS?
- Reduction in account takeovers – Decrease the percentage of customer support calls related to stolen or compromised accounts.
- Decrease in unauthorized account sharing – Track a decline in flagged multi-user accounts and excessive device logins.
- Increase in new subscriber sign-ups – Measure conversion rates from flagged sharers to paying users.
- Revenue impact – Drive a measurable lift in subscription revenue.
- Customer satisfaction (CSAT) improvement – Boost CSAT scores related to account security and user trust
- Adoption of security measures – Measure user engagement with MFA, device management, and other security enhancements.
WHAT IS THE PROCESS?
The project was very fast moving and high priority as soon as the red flags were identified and the quant data was synthesized. Leadership decided to make the top priority for the Identity & Access Management team, Trust & Safety team and Security team. Service Abuse was then broken into 4 phases with separate execution timelines,
- Phase 1 – Detention
- Phase 2 – Device Management
- Phase 3 – MFA via Email
- Phase 4 – MFA via App
The design process for each section was broken down into variants following the design thinking phases:
- Discovery Phase (Understanding and gathering phase of Quant Data, Customer Service Interviews, Qualitative research and Competitive Analysis)
- Ideation Phase (Low fidelity & high fidelity variants based on product team feedback, leadership visibility meetings and UX/design system feedback reviews, and real user early signal testing feedback)
- Refine Phase (Revisions based on user feedback, stakeholder feedback and A/B testing data feedback)
- Rollout Phase (Once all 4 phases released, post rollout data, deployment strategy, instrumentation tracking)
↳ DISCOVERY (empathize and define phase)
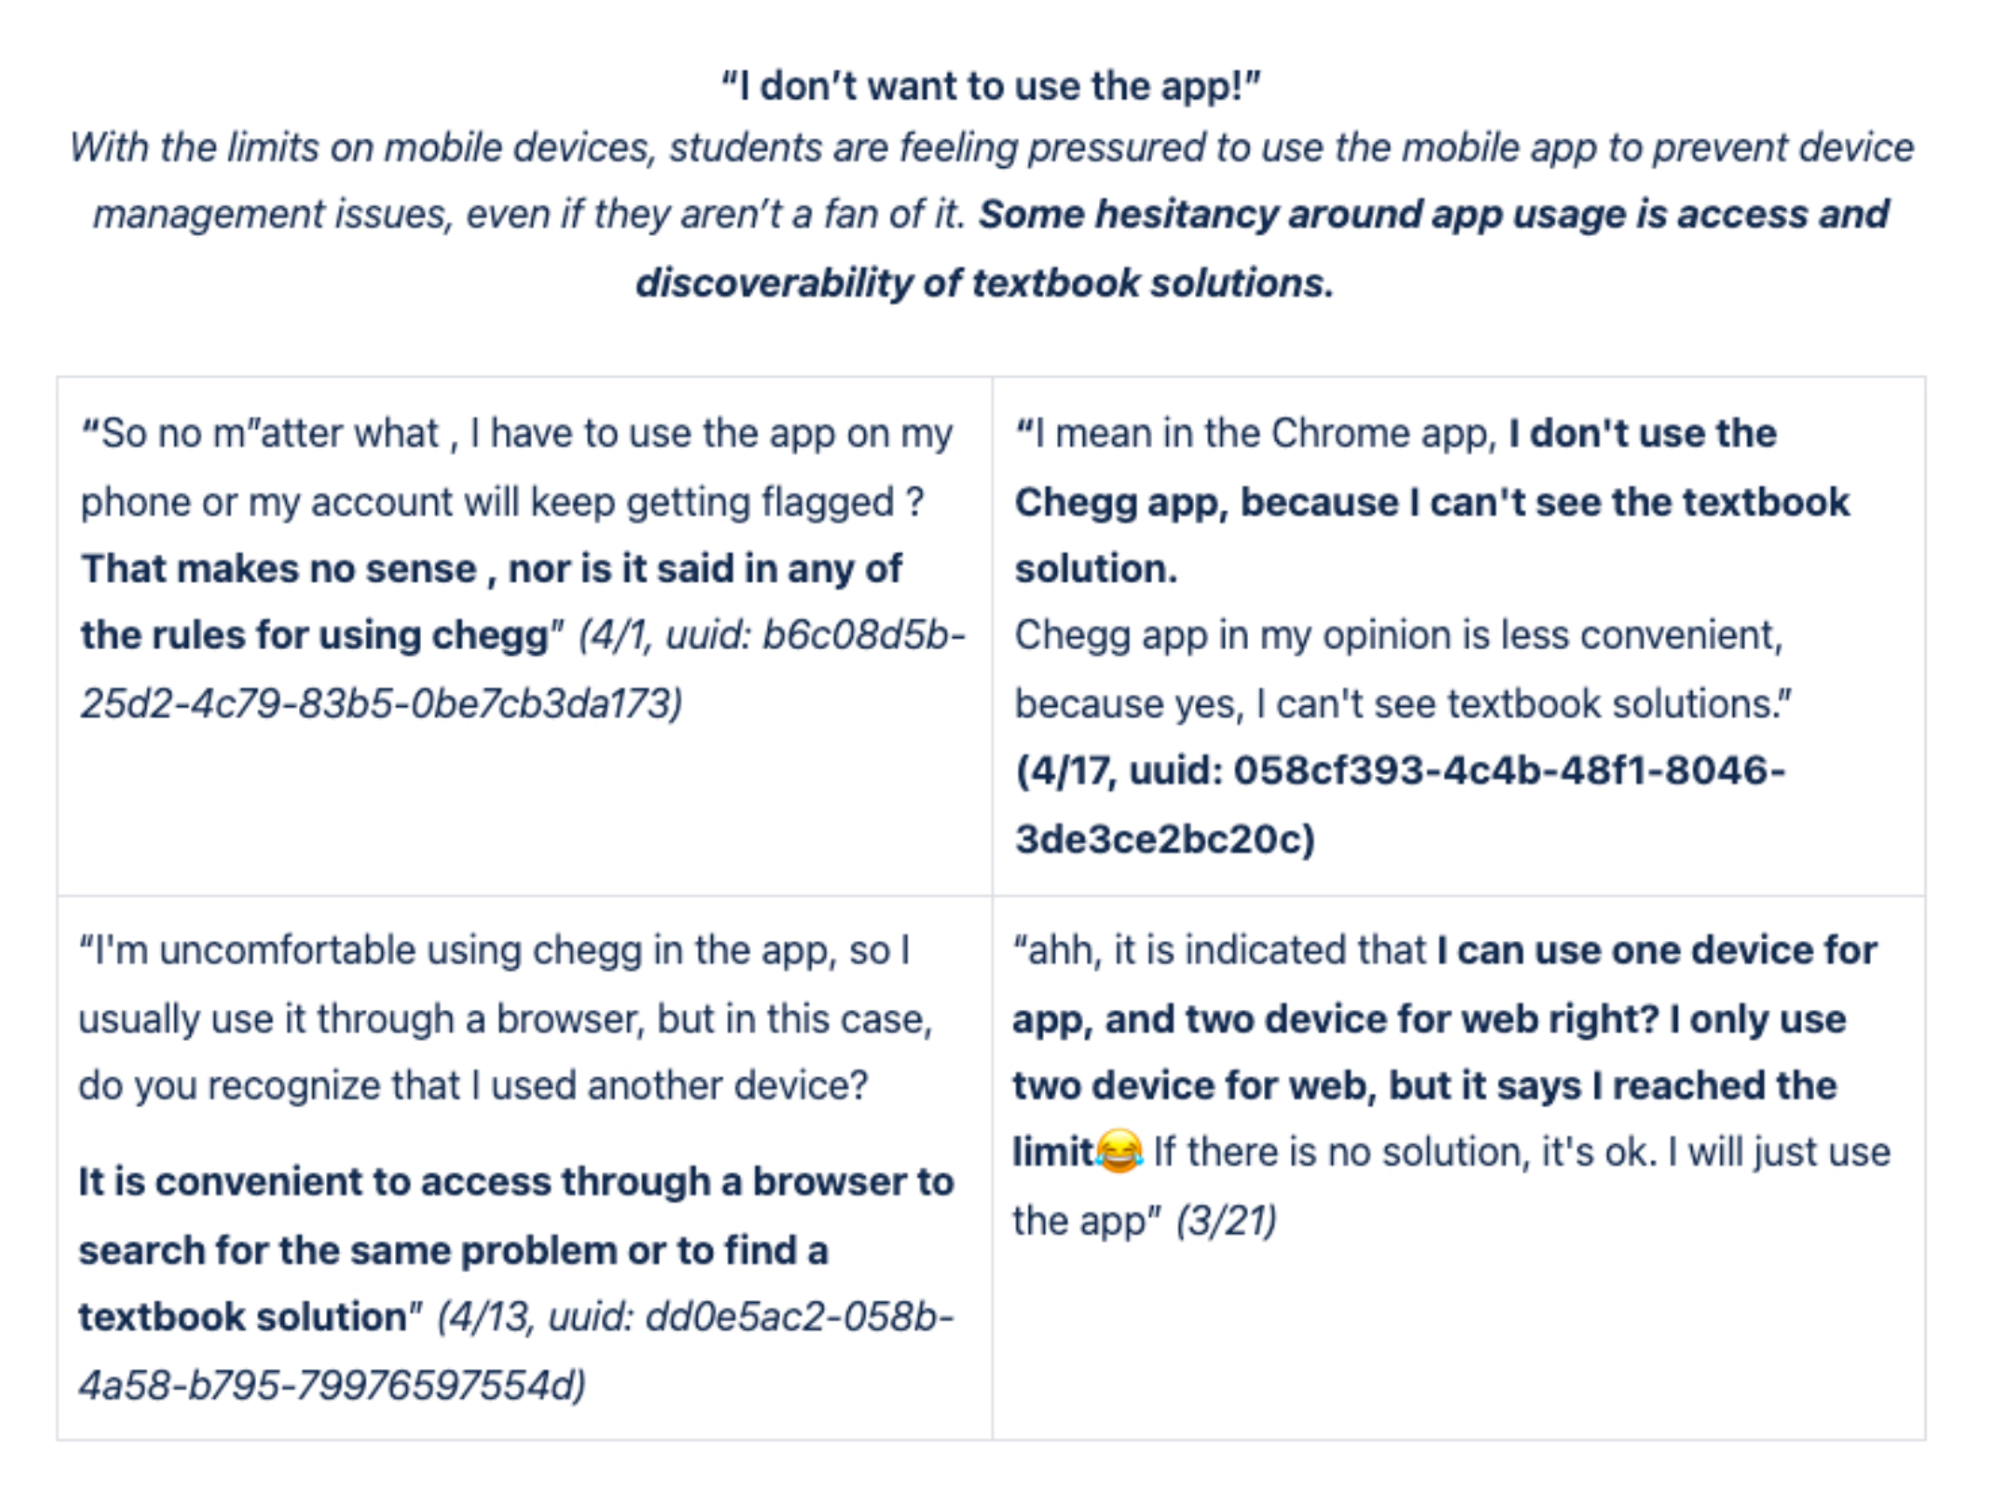
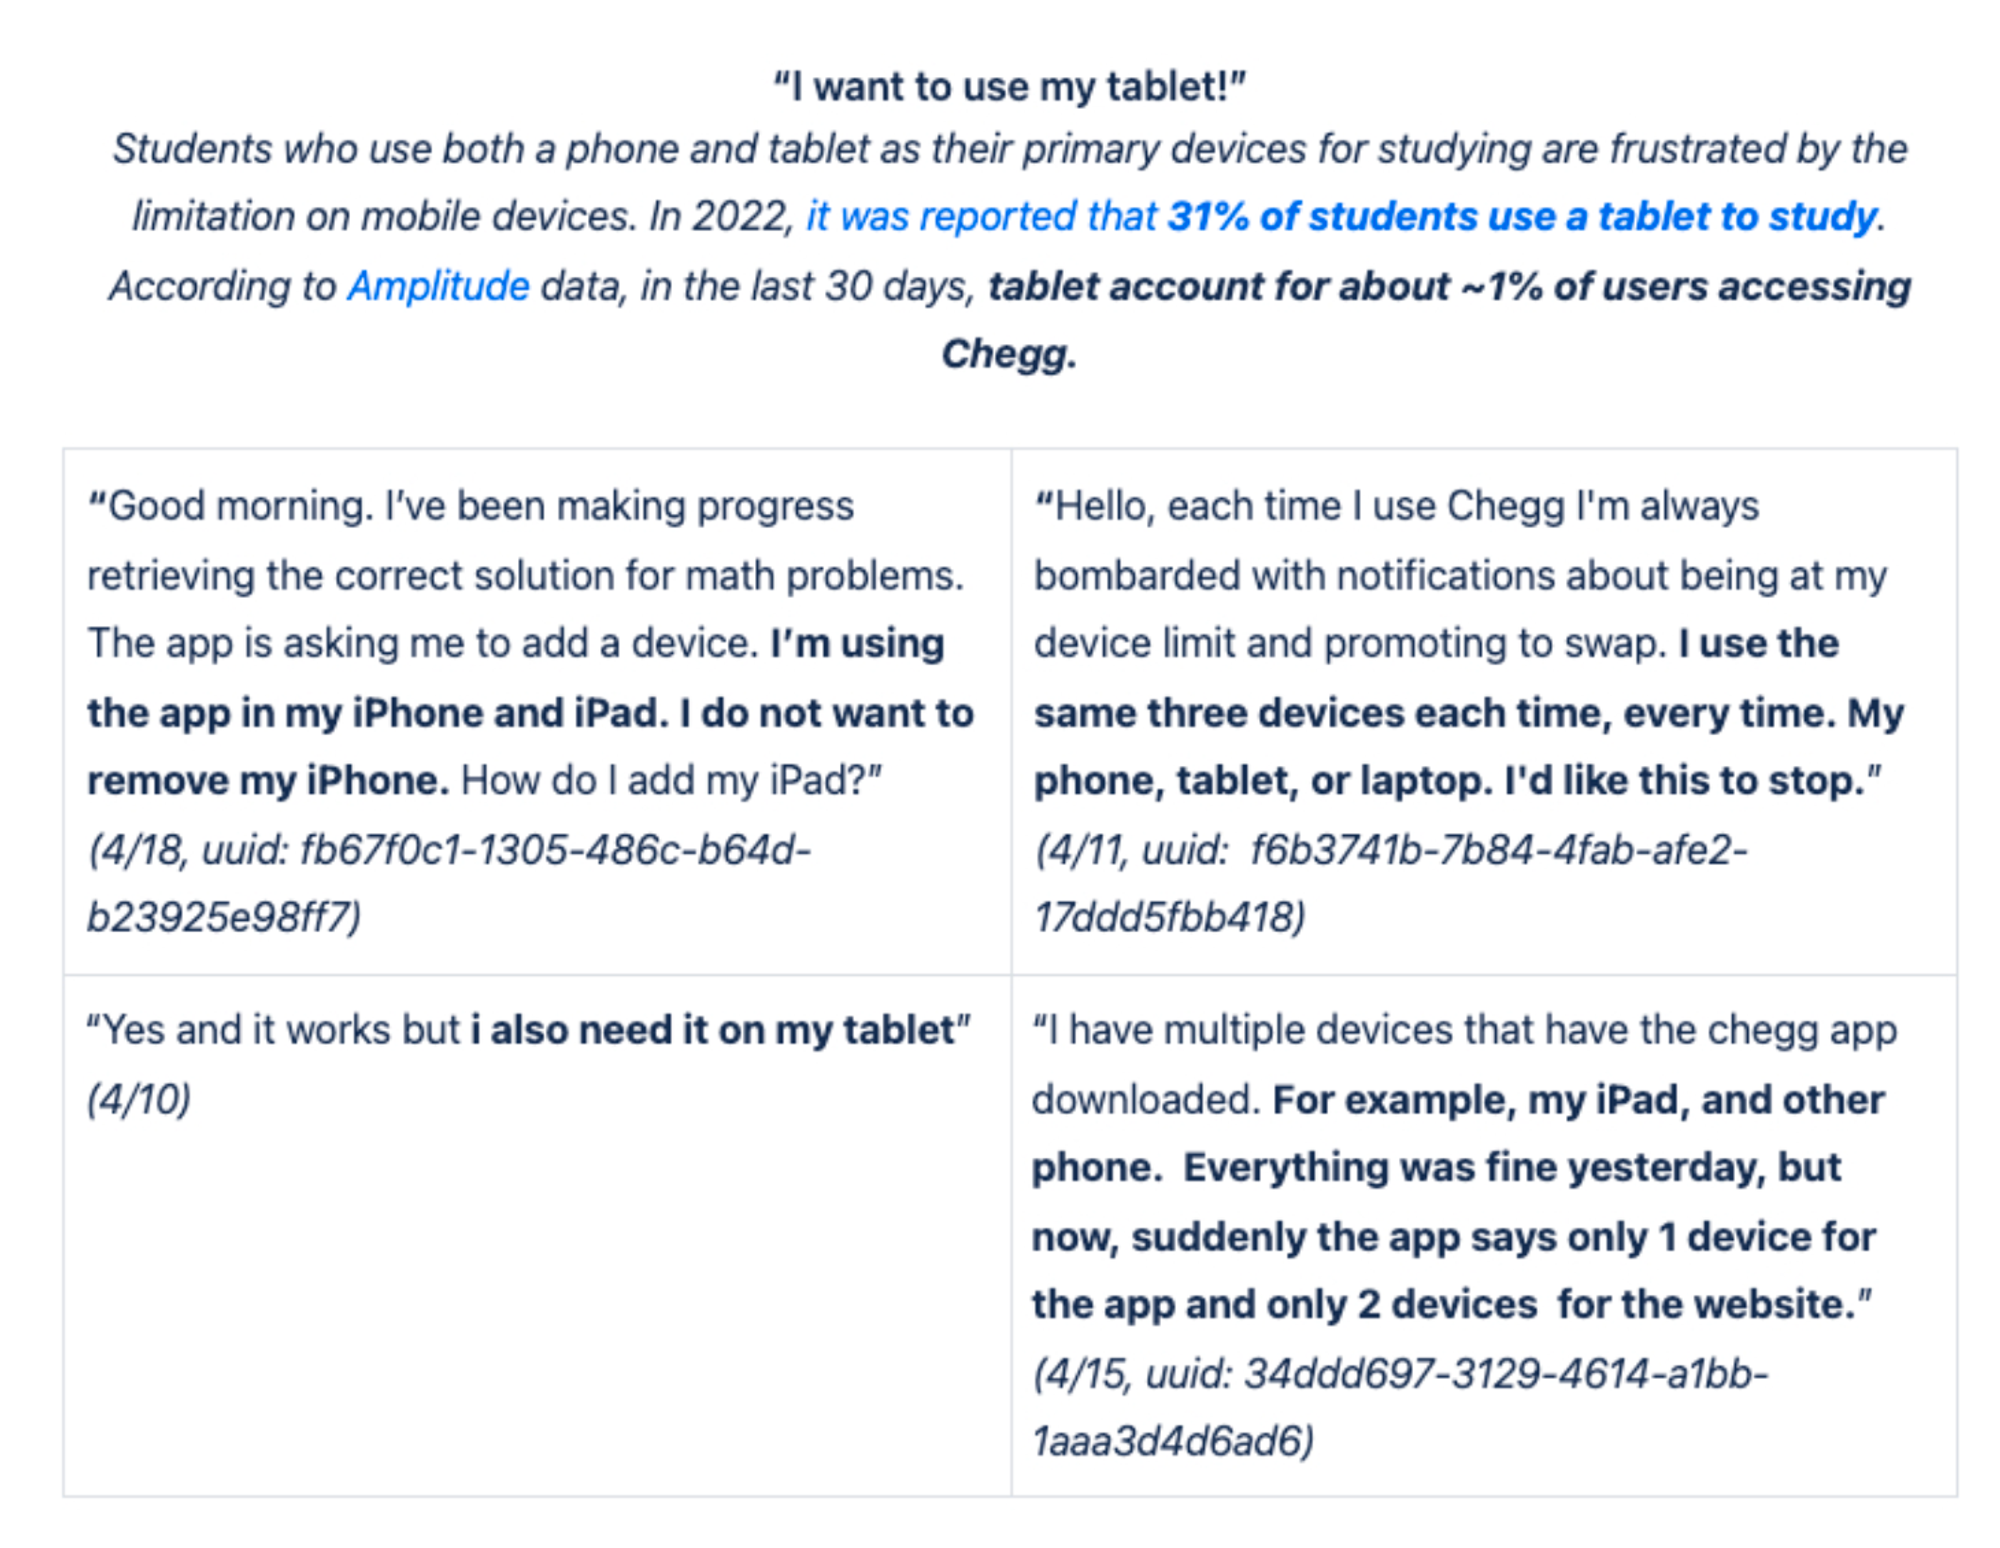
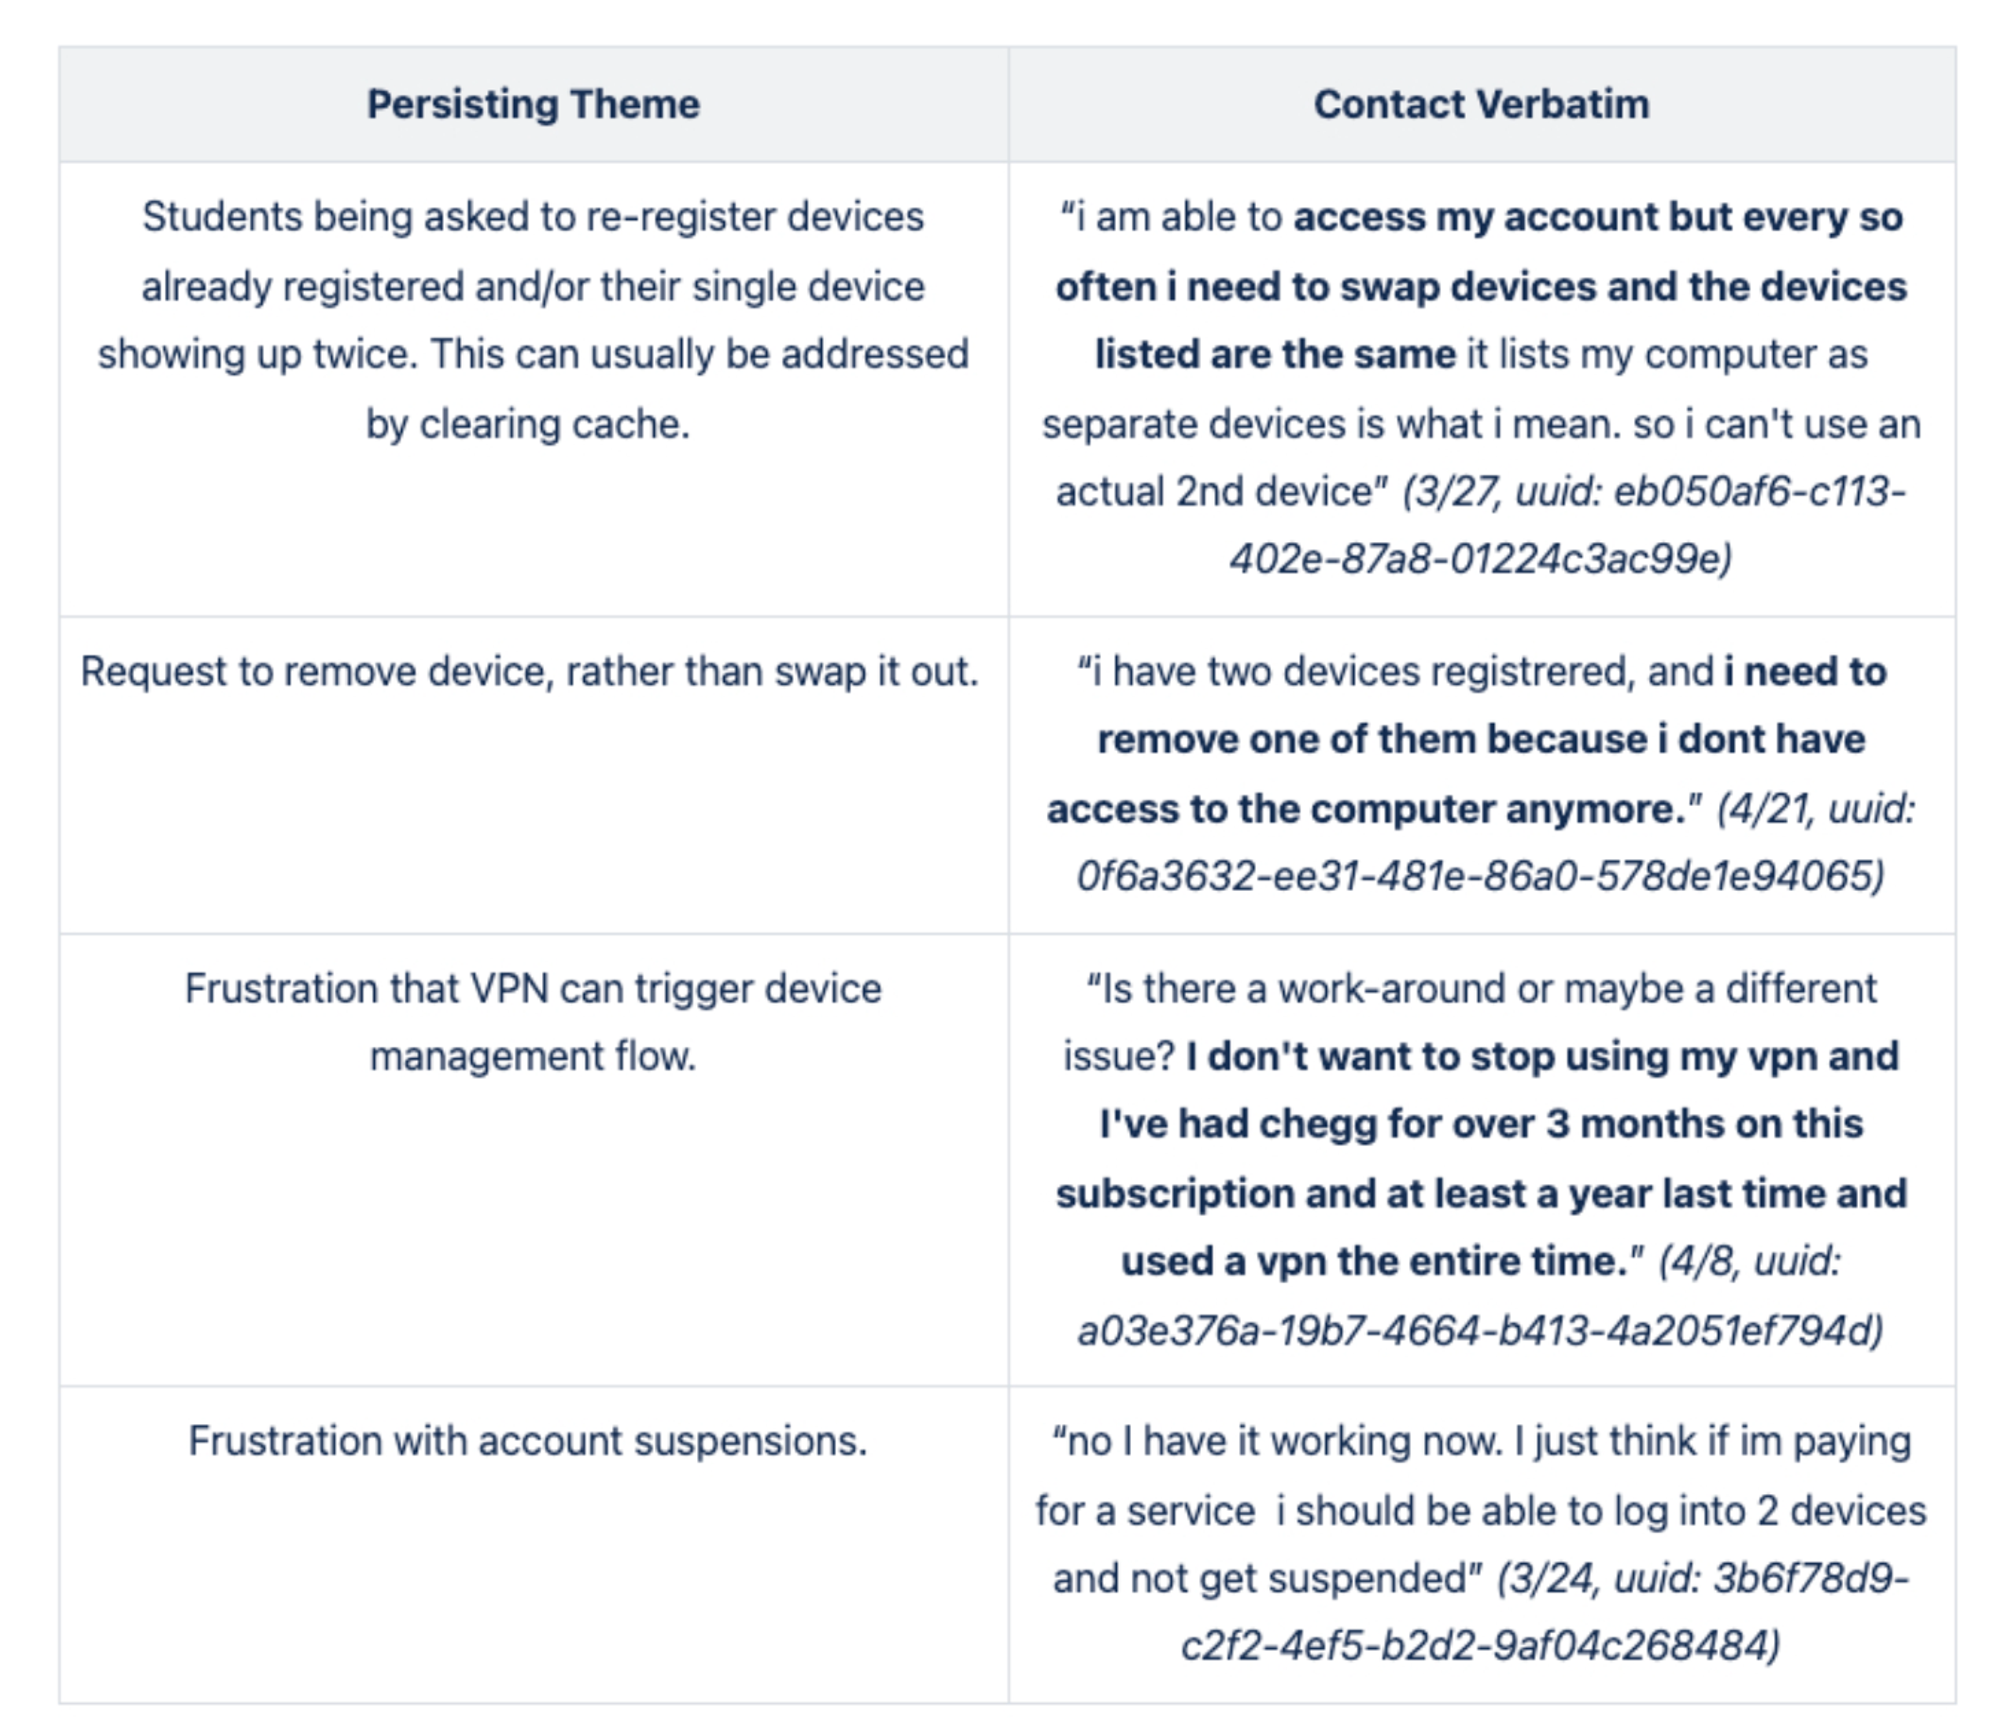
The process began with a deep dive into quantitative and qualitative research to uncover the extent and impact of service abuse. I analyzed platform analytics, customer support logs, and security data to quantify unauthorized access and identify common abuse patterns. Interviews with affected users, including both victims of account takeovers and those engaged in sharing, provided insights into motivations and pain points. This research revealed key challenges: widespread sharing behavior, trust erosion due to security vulnerabilities, and a perception that sharing was harmless. These findings shaped the problem definition and set the foundation for potential solutions.
Show More: Detailed data for the UX research interviews can be seen below in this toggle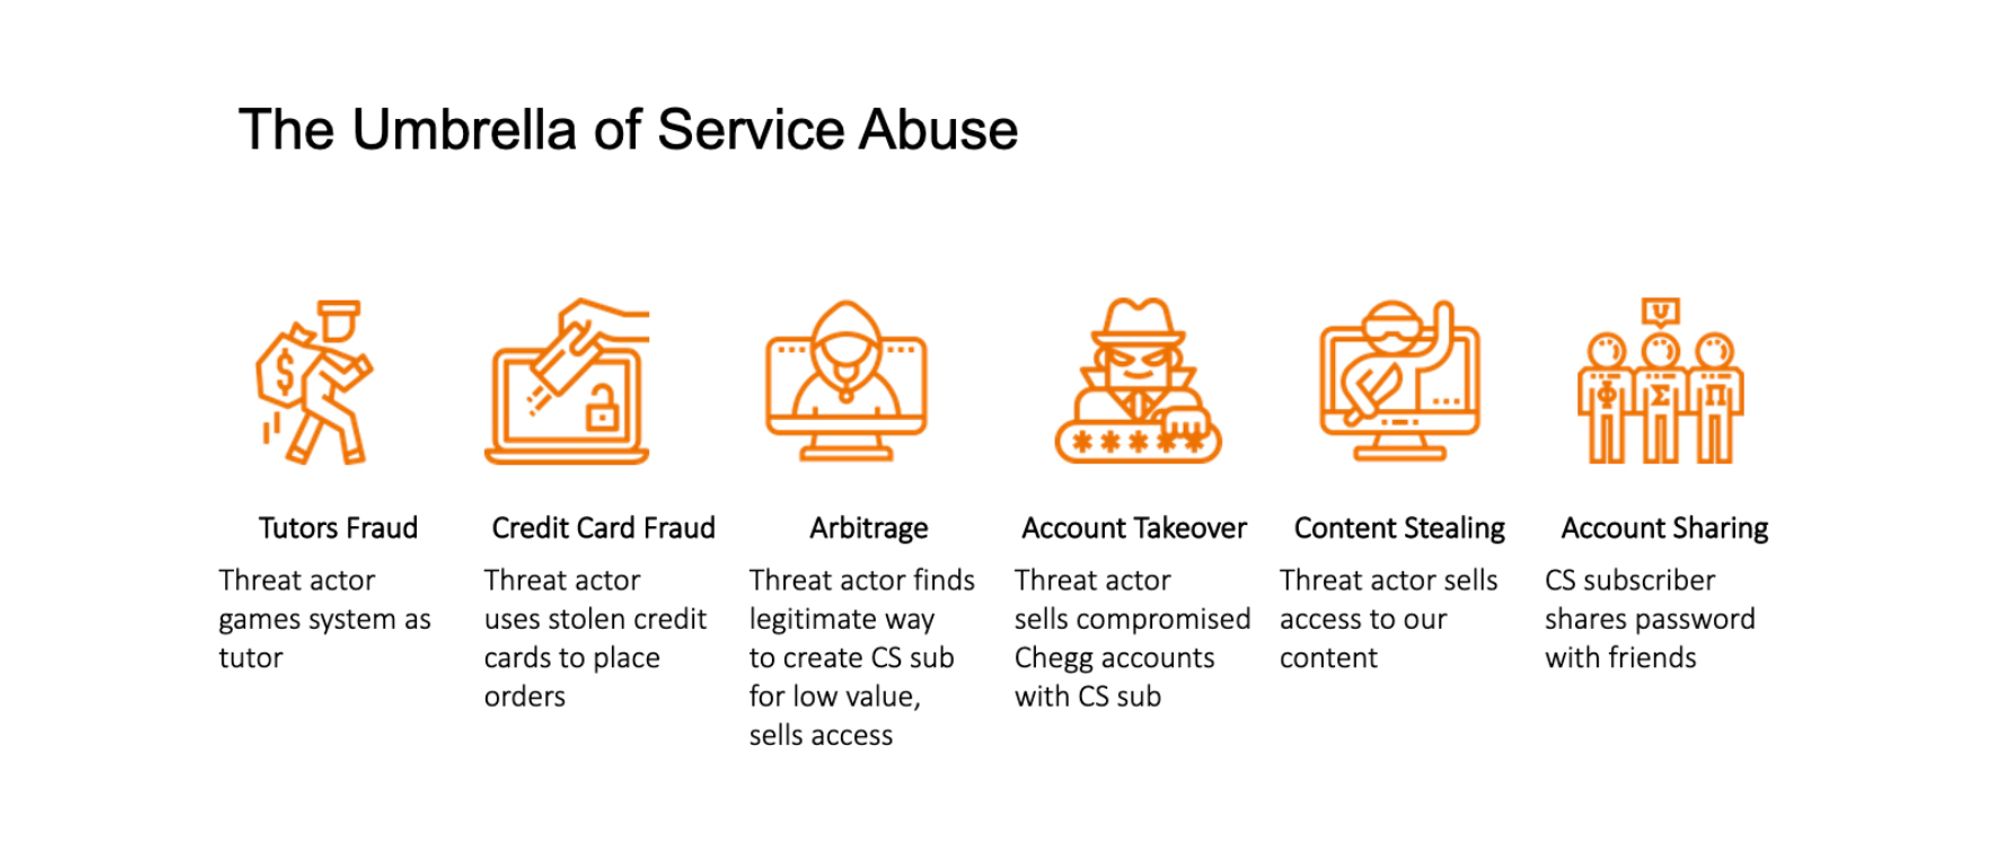
↳ IDEATION (ideate, prototype & test phase)
With a clear understanding of the problem, I explored intervention strategies that balanced security with usability. Multiple solutions were considered, including user education, deterrents, and stricter authentication methods. The team mapped out a phased approach, starting with low-friction deterrents like warnings and detentions before escalating to stronger measures like device registration and multi-factor authentication (MFA). Design explorations focused on minimizing disruption to legitimate users while discouraging abuse. Early concept validation through internal critiques and stakeholder alignment helped refine which interventions had the highest impact with the least risk.
↳ REFINE (revision and finalize phase)
Once key solutions were identified, I built and tested interactive prototypes to validate usability and effectiveness. Low-fidelity wireframes allowed for rapid feedback, while high-fidelity designs were tested with real users to gauge reactions. Early signal testing helped assess the clarity of warnings, the friction caused by security measures, and potential drop-off risks. Continuous iteration addressed usability concerns, such as simplifying device registration flows and ensuring MFA prompts were intuitive. Cross-functional collaboration with engineering, security, and customer support ensured the feasibility of implementation while maintaining a user-friendly experience.
↳ ROLLOUT (deployment and post-rollout data)
The final rollout followed a multi-phase deployment strategy to mitigate risk and measure effectiveness at each step. Phase 1 introduced warnings and detentions to nudge sharers toward compliance, followed by Phase 2’s device registration to limit unauthorized logins. Phase 3 and 4 added MFA layers via email and app authentication to enhance account security. Post-launch, the team closely monitored impact metrics, including subscription growth, security incidents, and customer satisfaction improvements. Regular feedback loops with customer support and real-time analytics helped refine the approach, ensuring that security measures remained effective without alienating legitimate users.
CONCLUSION
The multi-phased approach to addressing service abuse proved effective in reducing unauthorized access while maintaining user trust. By gradually introducing warnings/detention, device registration, and MFA, Chegg was able to curb fraudulent activity without disrupting legitimate users. Layering security measures allowed the platform to apply increasing levels of enforcement only where necessary, ensuring that legitimate users weren’t overwhelmed with excessive friction from the start. This progressive approach not only improved compliance but also helped users adapt to changes gradually. Ultimately, the initiative strengthened account security, improved customer satisfaction, and drove revenue growth through increased legitimate subscriptions.
FINAL METRICS
- 98% – reduced account takeovers by 98%.
- 17% → 1% – Customer support calls dropped from 17% to 1% for all calls related to compromised accounts
- 413K+ new subscriptions – 413K new subscriptions post-implementation of all phases (totaling $39M revenue increase)
↳ Learnings and Follow-ups
What went well:
- User research + analytics → Identified how and why users abused accounts, ensuring solutions targeted real behaviors, not just business assumptions.
- Data-driven alignment → Reduced subjectivity and helped teams prioritize the right problems faster.
- Multi-phase security rollout → Gradual introduction of security layers minimized user frustration and prevented churn while still curbing abuse.
What I’d Improve:
- Better user education → Many users saw security measures as barriers rather than protections; stronger in-product education and improved email campaigns could clarify the benefits.
- Rethinking enforcement → Some sharers unintentionally abused the system but were punished at stressful moments; alternative solutions like group discounts or multi-user plans could encourage voluntary compliance.
- Exploring behavioral nudges → More time collaborating with product teams could have led to less punitive, trust-building solutions that drive long-term retention instead of forced compliance.
Till this day, I still log and collect quant data feedback on account sharing through our analytics dashboard as well as attend a regular sync with the customer service team (student advocate team) collecting/discussing user feedback, aptly named “Customer Voice”. I keep an active Jira backlog of priorities ranging from p1s-p4s to keep as fast-follows or must-haves inclusions for the next phases.
Show More: user data behavior and verbatim customer feedback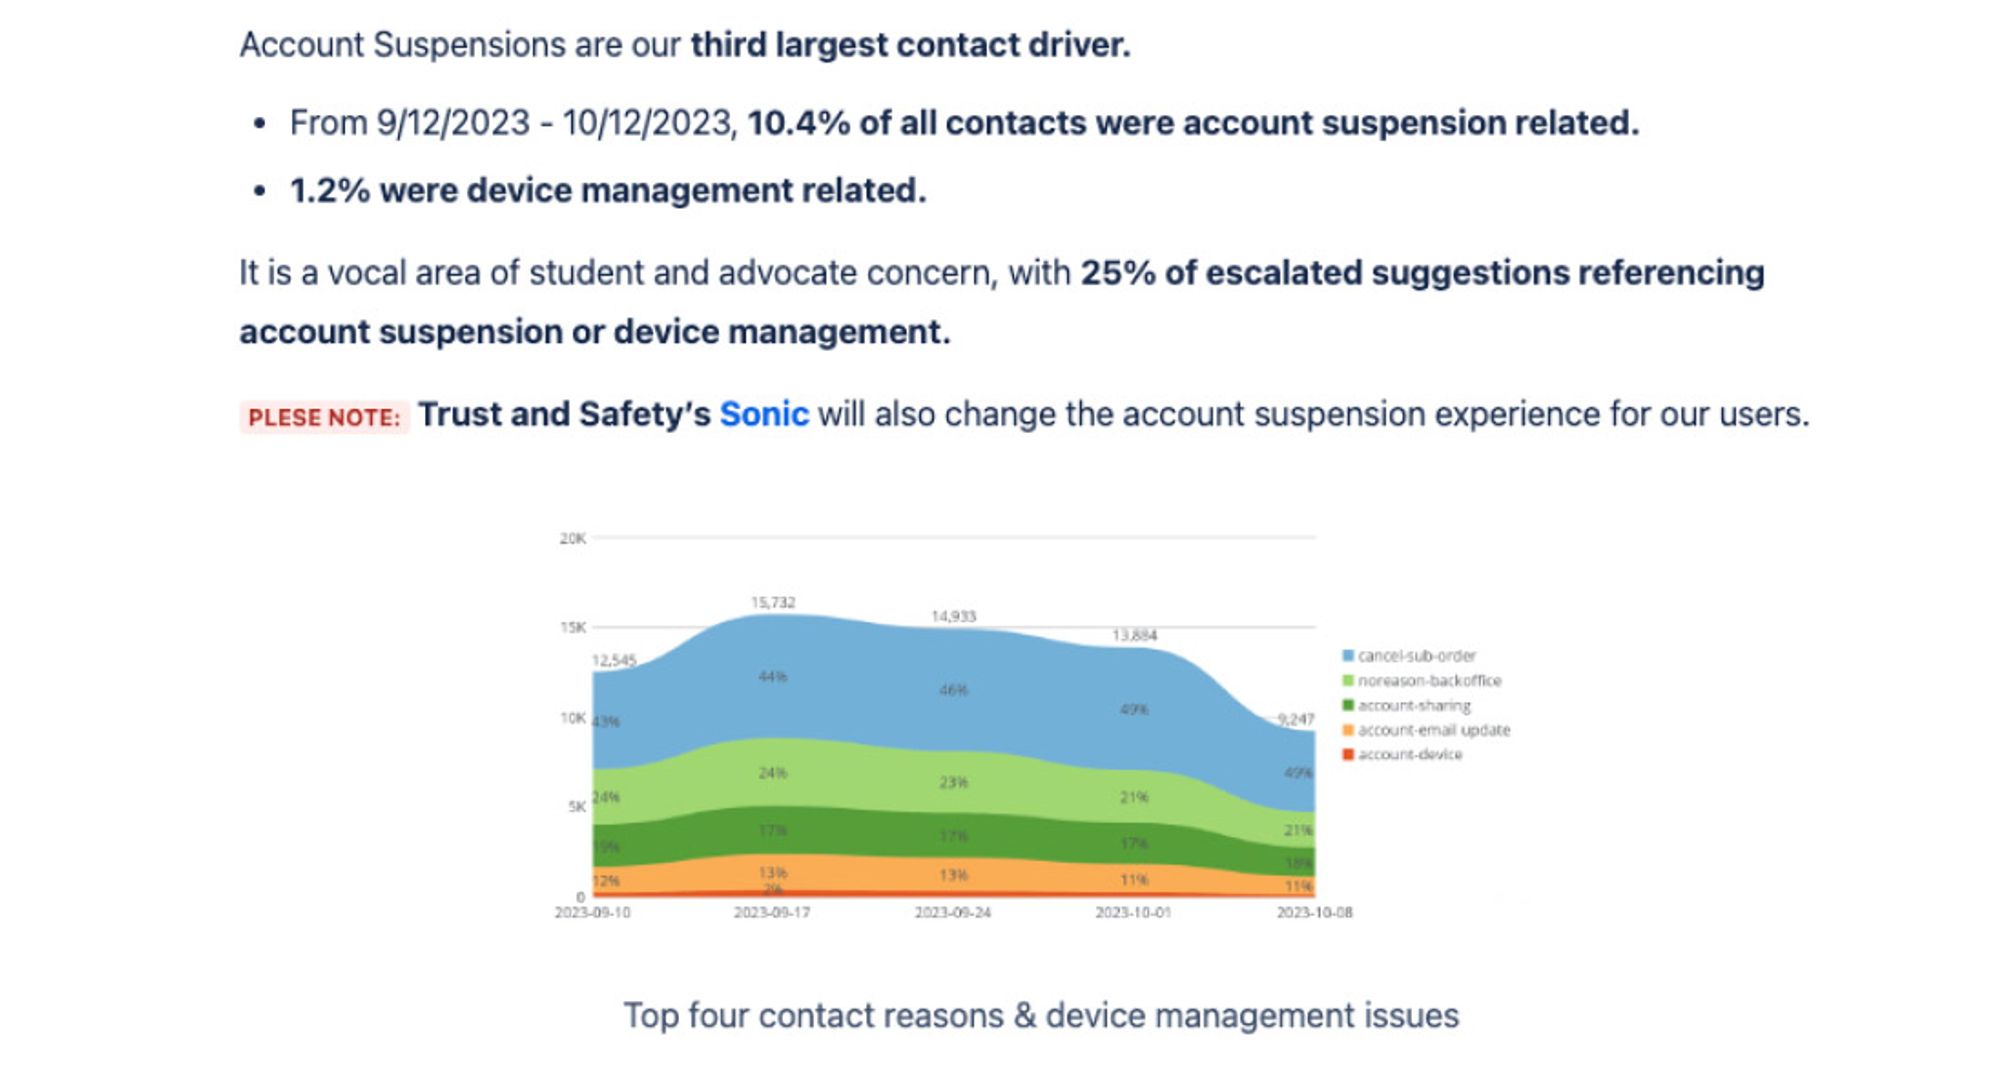
Atlassian Admin Launchpad
FINAL PRODUCT
Examples of the Launchpad screens


UNDERSTANDING & GATHERING PHASE
This was the most complicated project I'd encountered during my time at Atlassian. I was 3 months in and there was so much domain knowledge to acquire along with product, legacy and tech debt to understand. I had many whiteboard gathering, understanding and kick-offs. During this phase I also collected all quant and qual research to begin forming a hypothesis.
Quant data and research

Qual data (customer feedback & interviews)


Whiteboarding


IDEATE PHASE
This project was so big with so many moving parts and components, that I zero'ed in on one journey first, the most complicated journey, which was "adding a site to an org" for User Provisioning. I began by designing an end-to-end wireframe of the journey as a kick off point for discussion with the team and stakeholders. Once I landed on the UX, I ran some early signal testing to validate comprehension, discovery and task completion. I did this for every moving part of the Launchpad.
Wireframes

Early signal testing research


REFINE PHASE
After refining the UX in wireframes, I then put all the UI's into high fidelity designs. I created a prototype in inVision and put it in front of users to gather first impressions and perform basic tasks. Based on stakeholder and user feedback (a lot of micro and macro decisions), I finalized the designs and prepared them for handoff.
High fidelity design flows, sparring & feedback


Atlassian admin user qual feedback

inVision prototype for stakeholder and user feedback

Final design spec handoffs

RESPONSIBILITIES
- Research
- UX
- UI
- Interaction
- Product Management
WHAT IS IT?
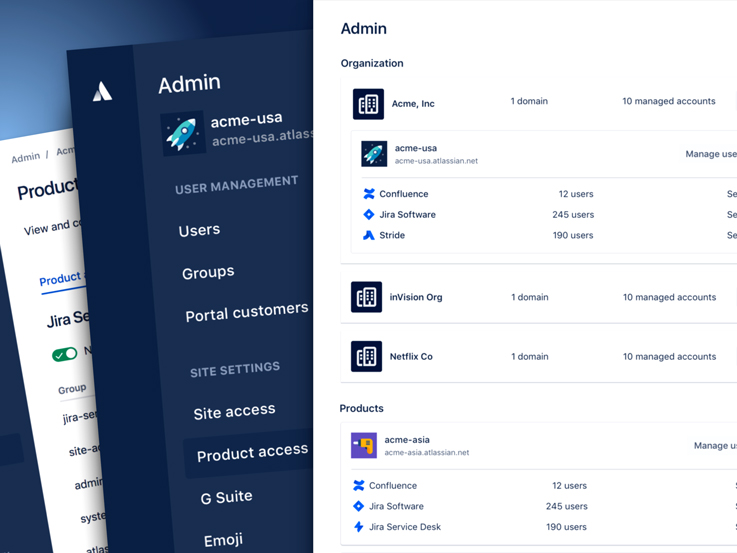
The Launchpad is a unified admin hub where the user will be able to ideally navigate through all the sites and products on their domain in one location.
WHAT IS THE PROBLEM?
Prior to the Launchpad, if an admin had dozens of sites (i.e. netflix-dev.atlassian.net, netflix-des.atlassian.net, etc) they would have to go to each of those unique instances to do any sort of user management. In order for an admin to “collect” all those sites under one place, they needed to create an Organization. Under this umbrella, all the sites and products become part of that Organization once the admin claims the domain (proves ownsership). Once the domain is verified, security features (Single sign-on, 2-Step verification, SCIM, Password Policy, etc) can then be applied to the Organization (all its users, products and sites) through a subscription to Atlassian Access. The problem with Organizations is that it’s a concept that is not familiar for most admin and a problem fairly unique to Atlassian (which adds to the complexity).
We know from various qualitative insights (customer interviews, in product feedback, surveys, etc), a few of the biggest problem today for admins are,
- Find it too hard to know exactly what they are administering for their end users
- Find it too hard to navigate between product projects and administrative features
- Don’t understand the concept or relationship of an Organization versus a Site
- Find it too difficult to manage their different bills
WHAT IS THE GOAL?
Our primary business goal was provide a clear link between sites and orgs in order to effectively monetize security features as part of Atlassian Access. The user need we were solving was to make it easier to understand the relationship between Organization (the umbrella) and Sites (the instances and products), a notion that was necessary but completely misunderstood or unknown. We set out to have a few high level goals:
- Unify the navigation between sites and orgs
- Make it easier to link a site and an org together
- Help users understand how their sites and orgs relate to one another
- Nurture potential security feature customers throughout the entire funnel from site admin to org creation to domain claim to Atlassian Access purchase
WHAT IS THE PROCESS?
Atlassian has a concept of a Triad which is essentially a group consisting of the Designer, Product Manager and Engineering Manager. The triad, through a collaborative process, establish a high-level product vision and the long-term roadmap for the product.
This project was so big and involved so many stakeholders that every micro detail was gone over dozens of times and communicated continuously with all the teams. At a macro level, there were three major components (and lots of smaller parts),
- The Organization and Site connection/linking (a necessity for SCIM User Provisioning that was being worked on concurrently)
- The unified admin Launchpad (which served as the new landing experience after all sites were migrated to one place)
- The Organizational overview page (the page where all Sites that were connected/linked to that Organization would show up)
The design process was broken down into a variant of the design thinking process for each of those phases listed above (details can be seen in the screens)
- Understand & Gather Phase (summarize past research, gathered and analyze existing data, document current state through confluence, had dozens of whiteboard sessions, kick-offs, etc)
- Ideate Phase (Explored the problem space, concept sketches, low fidelity wireframes, early signal testing, begin scheduling customer interviews, in depth stakeholder feedback and sparring, etc)
- Refine Phase (Test prototype in front of customers for insights, finalize design based on stakeholder & customer feedback, prepare designs for dev handoff)
CONCLUSION
The project, although encountered a few hurdles in terms of so many outside dependencies, hit it’s OKR date of Q2 2018 (Australian quarter, Dec 2018). Customer feedback was relatively positive as we resolved several of the user pain points (but not all of them, billing is still the overall biggest pain point). We allowed Organizational admins to navigate all sites within their domains and Site admins to have quick access to their top tasks (add users to groups, deactivate users, adding groups, create groups, etc).
This project also allowed me to have a lot of personal growth as I’d it was not smooth by any means. Miscommunication and triad un-alignment surfaced during stakeholder feedback and forced us to re-evaluate our team health monitor. I came out of it learning more about myself than I did the project.
Atlassian Access Awareness
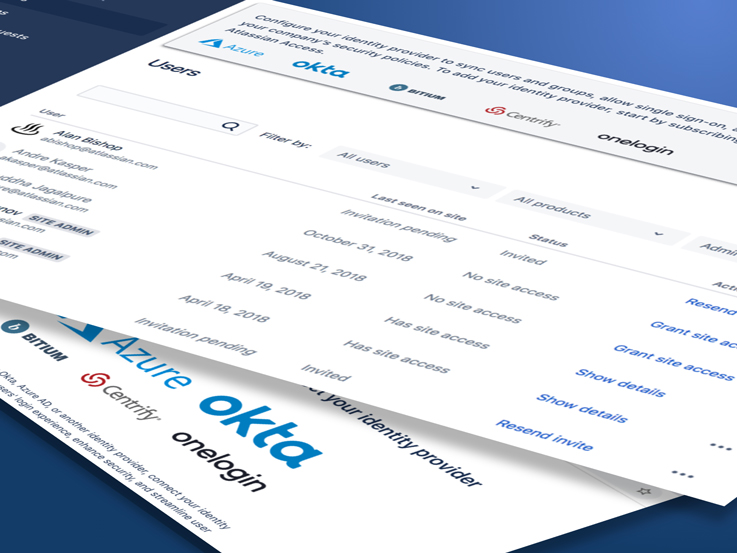
FINAL PRODUCT
Examples of the Awareness growth initiative screens


UNDERSTANDING & GATHERING PHASE
A bulk of my time was spent on dissecting existing data and user behaviors. I dove into quant data with a data scientist. I began breaking down the problem with my triad through whiteboading as well as work with another designer on journey mapping to empathize with the customer through their experience.
Quant data and research

Whiteboarding


Customer journey (conversion & churn)

IDEATE PHASE
I created high fidelity mocks that I sparred in person and async-ly (Mural app) with key stakeholders to gather feedback. I also did early signal testing to validate discovery and comprehension. I then re-iterated the designs accordingly based on the feedback and learnings.


Early signal testing research


REFINE PHASE
After several stakeholder and customer feedback sessions, I put the final designs into an inVision prototype to put in front of live users one last time. Designs are then finalized and are prepared for handoffs.


RESPONSIBILITIES
- Research
- UX
- UI
- Interaction
- Product Management
WHAT IS IT?
We are running a series of growth experiment to understand the top of the funnel of our feature product Atlassian Access. Particularly, we are measuring awareness (from product discovery to starting a trial) and activation (trial to feature enablement). The hypothesis is that by increasing the number of Jira/Confluence site admins who are aware of Atlassian Access, we’ll see a significant increase in the trial of Access in the test group versus the control group.
WHAT IS THE PROBLEM?
Through deep diving into the analytics with a data scientist, we knew the problem is that currently approximately 94.3% (of our targeted cohorts of 11-500 employees) of the Jira/Confluence site administrators are not aware of Atlassian Access today. That meant that only 5.7% of our targeted cohort even discovered the Atlassian Access value prop page.
WHAT IS THE GOAL?
The North Star goal of this project was to hit our company FY19 OKR of 350,000 paid Atlassian Access users (clear business goal). We’d reached 85% of our goal, but needed to improve the funnel through in-product awareness. We hypothesized that targeting customers specifically with Identity Providers would close the data gap. The reason we chose Identity Providers is due to the fact that the few who made it all the way through the funnel and become paid users, approximately 67% used SSO or SCIM (Identity Provider features). Our project goal was to deliver high impact with the least amount of dependencies.
Working close with the data scientist, we determined our metrics for success were:
- Increase awareness of the Atlassian Access discovery value prop page by 8%
- Increase of trial creations in the penetration rate of the test group versus the control group by 5%
Ultimately, for myself as a designer, the learning goal of this project is incredibly important as it’s the first time our Atlassian Access team has done a growth project. We’re hoping to gather data so even if we don’t get users to trial Atlassian Access (one of our key metrics for success), we’d like to learn if users,
- Don’t have an Identity Provider
- Don’t know what an Identity Provider is
- Have an identity Provider, but aren’t interested right now
The reason being that we can leverage this information to inform designs later in the funnel or revise our existing awareness designs.
WHAT IS THE PROCESS?
Much like other projects at Atlassian, the design process was broken down into a variant of the design thinking process all dependent on product scope, roadmap and timelines,
- Understand & Gather Phase
- Used this time to gather context and understanding by collecting and ingesting quantitative (redash) and qualitative (user interviews and feedback) data
- A lot of whiteboarding, summarizing past research and design efforts, and documenting current state (Confluence)
- Creating user journey and flows to help empathy mapping
- Ideate Phase
- Explored the problem space and began high fidelity designs due to time constraints
- Did several prototypes and put them in front of stakeholders feedback
- Wrote a test plan and did early signal testing to validate comprehension and discovery
- Refine Phase
- Put a prototype in front of live users one final time
- Finalized design based on stakeholder & customer feedback
CONCLUSION
This Awareness piece of this project is currently in development with a Q3 2019 release date (Australian quarter, end of March 2019). Con-currently happening is the Activation piece of the project (current project I am working on). Since this project is a growth initiative, it was very important to track the data very closely. Aside from our metrics for success, we are opting for learning to understand user behaviors as well.
Chegg Cancellation Flow
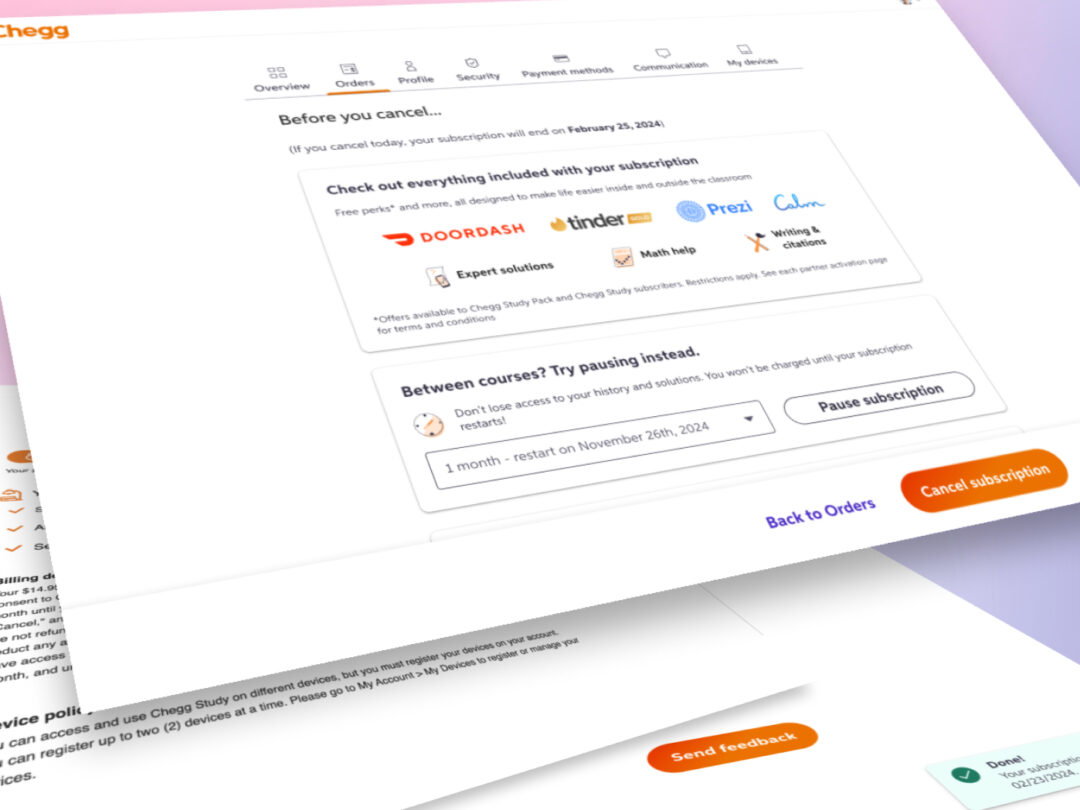
FINAL PRODUCT
A few examples screens of the final Cancellation Flow designs


DISCOVERY PHASE
The first step of the Discovery Phase was the understanding and gathering process which began with quantitative data deep dive of all data (niche journeys, revenues streams, flowchart breakdowns), qualitative interviews, product analysis with SMEs, documentation of current state and competitive analysis
Quantitative Data (I did a very deep dive into the quant data to understand the exact impact to the business in terms of revenue through data dashboards, analytics breakdown and SME interviews and syncs)
↓

Documenting of current state (collected all the current patterns and entry points related to subscription cancellations)
↓

Competitive Analysis (Completed an analysis of other products solving similar problems to strike a balance between necessities and constraints )
↓

IDEATE PHASE
For the ideation phase of Cancellation Flow, I went through rapid iterations and feedback cycles with wireframes, high fidelity designs and prototypes
Wireframes After the discovery phase, I fully understood the highest retention levers and potential revenue per user we’d be losing. I formed a design hypotheses and created wireframes and prototype for rapid feedback.
↓


High Fidelity (following wireframes and prototypes, I created multiple high fidelity designs variants along with prototypes here as well. This also included revisions after team, stakeholders, legal & leadership feedback sessions)
↓

Early Signal Testing (After I felt comfortable from all the iterations based on product team, stakeholder and legal feedback, I put the high fidelity prototype on usertesting.com to validate comprehension, discoverability and task completion)
↓

REFINE PHASE
After refining the design based on the early signal testing, I then finalized the designs and presented and did the final share out with both the legal team and then the leadership. This project was very high visibility due to compliance and had more check-ins than typical.
Internal Feedback (final stakeholder, legal and leadership. Async feedback was done through Figjam and final walkthroughs were done in person)
↓

RESPONSIBILITIES
- Research (early signal testing)
- UX
- UI
- Interaction
WHAT IS IT?
Years prior to my employment at Chegg, the company had “intentionally” designed a very nefarious flow which included many steps with no clear path or messaging for success in terms of cancelling their subscription. This would cause users who have meant to cancel, to not actually have cancelled their subscriptions as well as a giant influx of customer service calls during peak seasons.
WHAT IS THE PROBLEM?
This dark pattern was intentionally done years prior in order to use cancellation flow as a retention lever. The higher friction during the cancel flow while also showing the users many perks or reasons to not cancel would be laborious and often cause drop-off during cancelling. Thus, retaining a customer who would continue to subscribe (even if they did not intentionally wanted to remain so). This friction was noted by the leadership and legal team when federal and state regulations stepped in and required a “1-friction point max” cancellation by a specific date or face hefty fines.
WHAT IS THE CHALLENGE?
There were many challenges with this project but the two most glaring problems were:
- Immovable clear time line constraints and deadlines based on federal and state regulations
- Immense hefty fines for the company if these demands were not met
Along with the bigger two glaring challenges listed above, there were also smaller side challenges for me personally that also proved to be restrictive. These included,
- Being brought in days before the project ideation was set to begin
- New manager that had no familiarity with the platform and also was not part of any of the initial discussions
- Product & business came up with an execution plan with no design input and locked it for design deliverables (no formal kick-off)
WHAT IS THE GOAL?
- The user need is to provide a clear path to cancelling accounts and to have no more than a 1-friction point flow
- The business goal is to meet federal & state compliance regulations before the due date to avoid hefty fines
WHAT IS OUR METRIC FOR SUCCESS?
The business and product had a two part plan as to how they were going to measure success, those being:
1. Increase the cancellation completion rate close to 100% as possible for those who intentionally started and intended to cancel (as of today cancel completion rates were closer to 70%) which would then cause a huge influx of customer service calls requiring help for cancellation of subscriptions with a phone rep. This is clearly problematic as:
- Each call to customer service cost Chegg approximately $6 dollars
- This heavy incursion would happen during peak season times for something that could be fixed with UX on the product itself
2. Begin plan about the retention levers and where they could be applied for the definitive drop in retention and revenue (although it was a smaller number in comparison to other products, the cancellation flow was a way to retain revenue with existing users)
WHAT IS THE PROCESS?
Due to the constraints listed above with the challenges, this project was very fast moving with discovery, rapid design iterations and team/stakeholder feedback along with prototypes and early signal research testing. Specifically, the project was broken into my normal discovery, ideation and refine process.
Discovery Phase
- 1 week for understanding and gathering of discovery (quant data, defining problem space, identifying goals and metrics, etc)
Ideation Phase
- 1 week for ideation of low fidelity, high fidelity, prototypes, early signal research testing with users
Refine Phase
- 1 week for final stakeholders and legal and compliance finalization
CONCLUSION
During the process of the discovery phase, I realized quickly that I did not agree with the metrics set by the product team (hence, why it’s important to have a designer in the discussions and proper kick-off). I formed a design hypotheses that we could combine the metrics for success in a v1, rather than having it as a separate goal. I designed a wireframe variant, pulled my PM and lead engineer into a room to show my hypotheses but also to verify any of the constraints or dependencies.
After confirming we both PM and engineering that it was plausible, I approached the VP of customer service and head of operations. After showing them a wireframe prototype about being able to solve two problems in one MVP, both agreed with my hypotheses and I was able to move forward with these design variants. This allowed the team to create an A/B test and do a measured roll-out to make sure we weren’t harming the product.
Product Data Metrics
- Cancellation completion rate in the test cell was 98.4% (versus 78.9% for the control cell in the old designs)
- Retention Lever Rates (pausing) increased by +9.2% in the test cell, indicating that users were now aware of pausing subs (meaning business retained the active paying subscriber)
- Customer service contact rates dropped by –10.8% in the test cell (again, each call to customer service cost Chegg approximately $6)
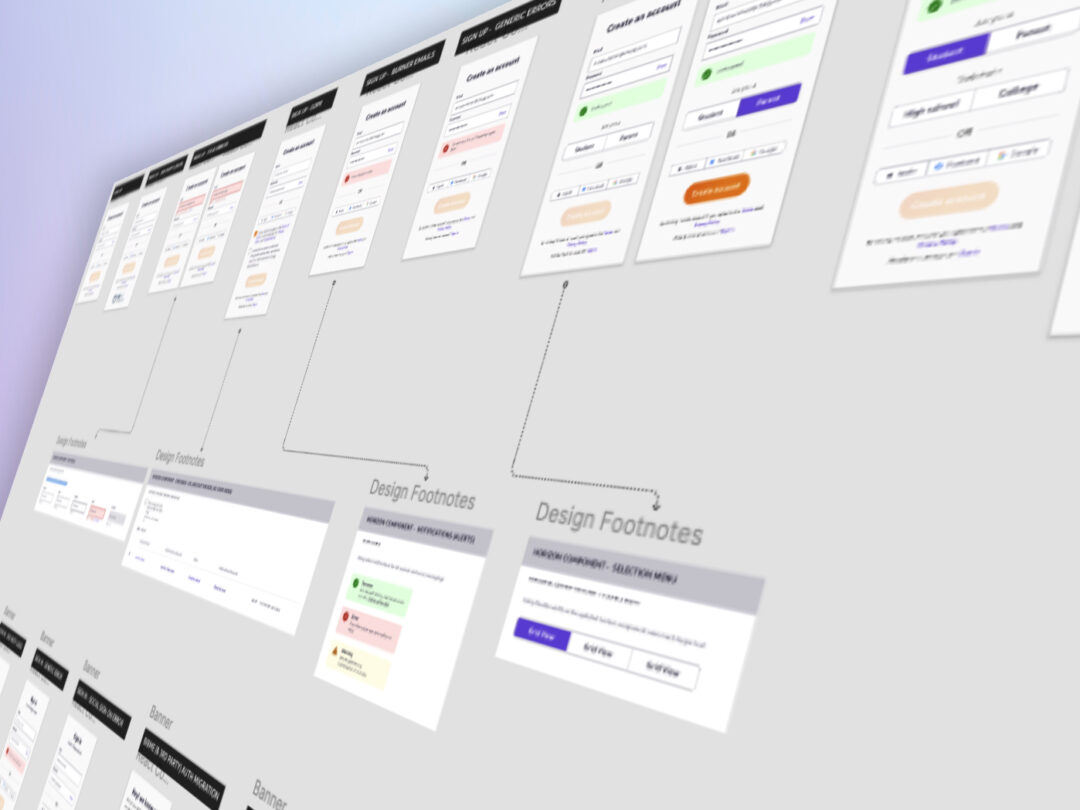
Chegg OneAuth™
FINAL PRODUCT
A few example production screens of OneAuth React/NextJS components.


DESIGN SOURCES
Some example Figma source design screens of source components, use cases, prototypes and design flows


RESPONSIBILITIES
- UX
- UI
- Interaction
WHAT IS IT?
OneAuth was part of an entire platform migration stemming from problems of accumulated tech debt. The migration moved away from our Jericho platform and more towards a modern end game solution (our old solutions had multiple SDKs and APIs, the modern solution simplified and optimized the paths). From a design and front-end perspective, this meant we could replace legacy components with modern React components. This not only modernized the entire front-end and back-end platform, but was now relieving major constraints and existing blockers for product teams which was a proactive initiative for the platform I had pushed for years (with many ups and downs as well as set-backs).
WHAT IS THE PROBLEM?
When solving the Account Sharing problem, we went through 4 phases of solutions. However, all these solutions were,
- Used throwaway code to solve for a specific niche problem on a product (e.g, MFA on a Chegg content pages)
- Using throwaway code meant these were not scalable solutions to the problem
- Imposed massive security and trust & safety issues as it touched so many end-points
This was a classic platform problems of solving things “quicker” to meet a business need at the cost of accumulating more tech debt. There eventually comes a point where short term solutions no longer work as,
- The tech debt gets too large
- The platform services are so outdated, they cannot support modern 3rd party services (e.g, want your Auth to support biometrics etc)
Ultimately, platform upgrades are always difficult because they,
- Are very time consuming and resource heavy (very expensive for the business)
- Don’t provide a clear immediate ROI (as in doing X will increase conversions by Y%)
Platform services are a long tail which pay down tech debt (can never get rid of all tech debt and it will be “outdated” by the time it’s implemented) and set up teams to move faster in order to achieve those more immediate metrics.
WHAT IS THE CHALLENGE?
As touched upon a little bit in the problem section, it’s very “costly” and time consuming. Platform tends to be more of a reactive team than a proactive team. What this means is that updating a platform is a very proactive initiative. The business tends to push back on proactive projects and use the resources (product, dev and design) for more reactive projects as they provide more immediate monetary returns (e.g, developing and designing a new SDK or API for a feature).
Another challenge I had personally is that I am the only designer on the platform team. During my tenure as the Identity & Access Management designer, I’ve watch 3 lead PMs enter and leave. With platform being fairly technical, it takes a PM a bit of time to ramp up and truly understand the product/platform. But often as we begin to work on an execution plan, that former PM leaves and this rebuying-in process must start all over again with the new PM (this includes ramp up, building trust, and re-clarifying the goal).
WHAT IS THE GOAL?
- The user need is to provide a more seamless and optimized experience (modernizing of services will improve performance time and completion rates down the funnel).
- The business goal is to update the outdated tech stack to allow future products and features to scale on the platform while reducing security risks (this also includes migration of all other Chegg sign in/sign up/ password/ etc services not on the new OneAuth tech stack that is being developed by the Identity team).
WHAT IS THE PROCESS?
This project is very intertwined with my stakeholders but primarily engineers, architects and back-end services. From the front-end and design perspective, it was about redesigning every existing outdated component and working with the design system team (working with accessibility, engineers and design) to create React variants of the components to be adopted into the new design system (internally named Horizon).
When this project started, every team was doing their discovery concurrently. There was no official brief or requirements but the current PM on it had mentioned a couple of basic use cases,
- Sign In Component
- Sign Up Component
- Password Component
The use cases were not documented so I had to work closely with a FE engineer and go through the code base together to identity all the use cases and edge cases (odd errors, niche flows, etc). The initial sizing estimate was small to medium as based on these conversations it was just a matter of
- Designing responsive sizes
- Taking molecules, atoms and foundation components
- Working with accessibility to add in all the correct tagging and meeting the minimum AA compliance
- Syncing with key stakeholders
But quick came to realize during my discovery that this was a large to extra large effort as there were dozens of unidentified must-haves for this MVP. We were missing many use cases not yet identified as well many stakeholders from misc products still not identified. This is where my PM and I divided and conquered,
- He would tackle all the product and engineering meetings
- I would tackle all the design, accessibility and research meetings
We would then have 1:1 meetings twice a week (more if needed) and then do a stand-up style session where we filled each other in on all the detailed updates. This “non-scalable” way of working was only possible because we had built such a trusting working relationship. These 1:1 sessions were on top of our overlapping team meetings or required stakeholder meetings.
CONCLUSION
The most important metric we wanted to measure against was the DNH (do no harm). Chegg had a very low tolerance, if things trending even 1-2% in the wrong direction, leadership would force a deep audit and likely rollback. Even that small of a shift meant millions of dollars of lost revenue. This was not something the business was willing to wiggle on. So it was important to measure OneAuth (our new tech stack) with SuperAuth (our previous outdated tech stack).
The team did a slow rollout release of OneAuth with some key details (with a rollback plan to revert if anything went wrong):
- An entirely random allocation
- Desktop & mWeb (without native apps)
- Chegg clients only (Chegg.com/auth only – with none of the other suite product external domains)
- No specific region based
Fortunately, the final metrics not only did not do any harm, but also trended positively (all data tracked with Amplitude).
Product Data Metrics
- Sign In rate: OneAuth had a sign in rate of 80% (versus 54% for SuperAuth)
- Sign up rate: OneAuth had a sign up rate of 20.6% (versus 14.7% for SuperAuth)
- Error rate: OneAuth error reduction rate drop -22%
- Subscriber journey drop off rate: Users had a higher sign up completion from subscriber pages and drop-offs reduced by -29.5%
Atlassian API Token Management
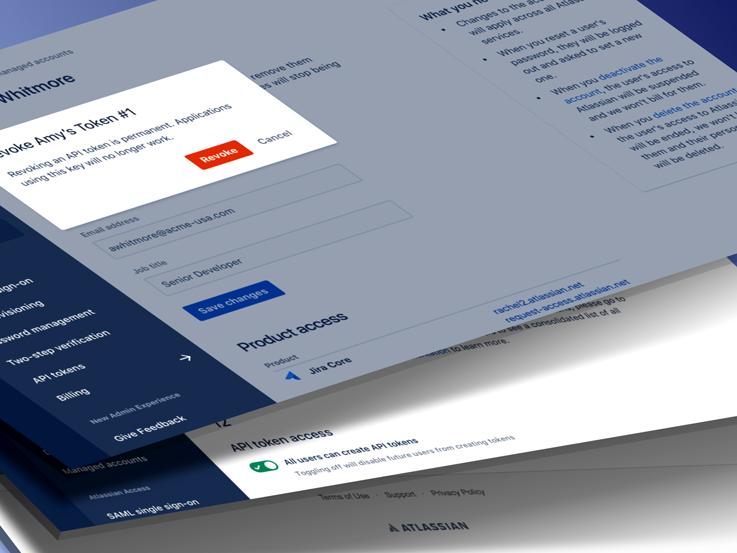
FINAL PRODUCT
Examples of API Tokens screens in the organizational admin panel


UNDERSTANDING & GATHERING PHASE
Having very little domain knowledge, I began by collecting all my assumptions & questions, summarized past research (redash analytics for quant & user feedback for qual) & design efforts (competitive analysis) as well documented any of the current state. I then booked time with the lead developer on the project to whiteboard what my understanding on API tokens.

IDEATE PHASE
Having a robust design system and toolkit, along with time constraint; I jumped straight into several high fidelity mocks that I sparred in person (print outs on walls) and async-ly (Mural app) to gather stakeholder feedback and re-iterate.


REFINE PHASE
After several stakeholder feedback sessions, I put the designs into an inVision prototype that we can test in front of live users. The team I work on is customer obsessed and will often conduct user interviews and feedback sessions. I used this time to validate designs in front of customers and then re-iterate accordingly. Designs are then finalized and are prepared for handoffs.

RESPONSIBILITIES
- Research
- UX
- UI
- Interaction
- Product Management
WHAT IS IT?
API token is a personal identifier of an application requesting access to your service. They are unique credentials assigned to individual users. An overly simplified way of thinking about it (and potentially flawed) is my badge that I use to buzz myself through the company door. It’s unique to me, but should I lose it, anyone could buzz in with my credentials (here is a very well written medium article explaining API tokens).
WHAT IS THE PROBLEM?
Today, every user can generate API tokens on id.atlassian.com, regardless if they’re a managed account of an organization or not. API tokens allow the user to authenticate with Cloud apps and bypass two-step verification and SSO, and retrieve data from the instance through REST APIs.
These tokens don’t expire and are subject to almost no limitation or controls today. The user can revoke their own token, but there is no way for an administrator to view, limit or revoke the use of these tokens. It’s hard for admins to even know that their users have created API tokens and are using them to call Jira and Confluence APIs. This means that the admin’s content is never fully secure or under their control.
WHAT IS THE GOAL?
We set out to have two high level goals:
- Give organizational admins the ability to control the creation and usage of API tokens created by the managed accounts of their organization in order to ensure that their content is secure.
- Enable better user, content and security administration at scale.
WHAT IS THE PROCESS?
Atlassian has a concept of a Triad which is essentially a group consisting of the Designer, Product Manager and Engineering Manager. The triad, through a collaborative process, then establish a high-level product vision and the long-term roadmap for the product.
As a triad, we concluded this timeline was tight and we didn’t have enough data on user behavior; so we decided to establish an MVP product to add value to our flagship product (Atlassian Access) as there were multiple other streams and projects we were all working on. We broke down the project in this way,
- Defined the problem space (why are we doing this? Impact of the problem, etc)
- Defined our metrics (How do we judge success? etc)
- Defined the hypothesis we wanted to validate (What user need are we solving while aligning with our company OKRs? etc)
- Defined our goal and milestones (What is the MVP? How does it align to our roadmap? etc)
- Defined our scope (what we are doing, not doing, future states, etc)
- Identified our dependencies and assumptions (who are the stakeholders? How will this affect their roadmap and our timeline? etc)
The design process was broken down into a variant of the design thinking process to adapt to product timelines,
- Understand & Gather Phase (summarize past research & design efforts, gather and analyze existing data, document current state, whiteboard, etc)
- Ideate Phase (Explore the problem space, high fidelity designs due to time constraints, prototype, early signal testing, begin scheduling customer interviews, E2E demos, etc)
- Refine Phase (Finalize design based on stakeholder & customer feedback)
- Rollout & Improve (Keep track of analytics, observe user behavior, capture any design debt, determine next steps for products)
CONCLUSION
Once we prioritized the user stories and knew our scope clearly we broke the project down into 3 major milestones.
We recently released Milestone 1 (MVP) which encompassed the must-haves we needed to deliver so customers can start deriving value from having API token controls. In summary, the org admin needs to be able to view the tokens created by their managed users on the user profile page, individually revoke the tokens for these users and set expiry scope on the tokens.
Since we have no sense of usage, customer awareness or expectations for API tokens today, our goal is to gauge customer feedback from the shipped Milestone 1 before commencing work on Milestone 2. Milestone 1 is currently in development and is set to release at the end of Q3, 2019 (Australian quarter, end of March 2019).
Atlassian Request Access
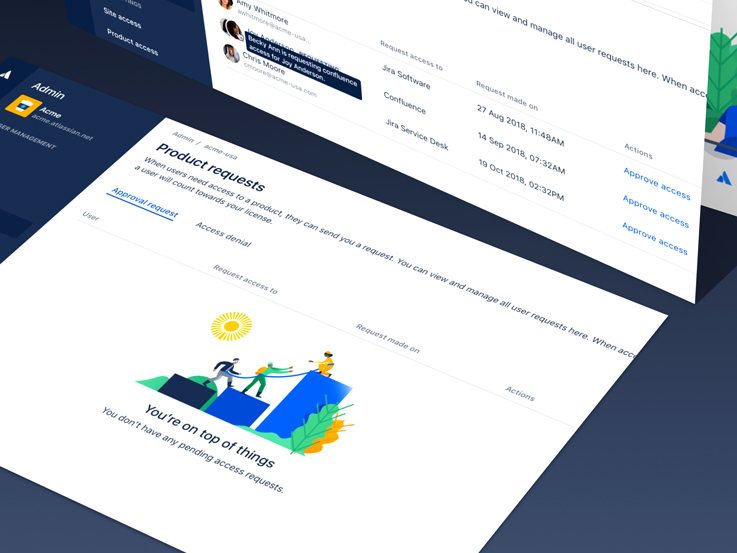
FINAL PRODUCT
Examples of the Request Access screens


UNDERSTANDING & GATHERING PHASE
Although this was a product initiative to increase MAU on Confluence/Jira, a major part of the interactions and logistics all happen within the admin portal side. I spent most of the time gathering context with PMs doing several whiteboarding solutions and calling out assumptions and dependencies.

IDEATE PHASE
Having a robust design system and toolkit along with time constraint (much like the API token project), I jumped straight into several high fidelity mocks that I sparred async-ly (Mural app) to gather stakeholder feedback and re-iterated. The entire team for this project was in Sydney, Australia so the entire project had to be done async.

REFINE PHASE
After several stakeholder feedback sessions, I put the designs into an inVision prototype that we can test in front of live users. The product I work is customer obsessed and will often conduct user feedback sessions. I use this time to validate designs in front of customers and then re-iterate accordingly. Designs are then finalized and are prepared for handoffs.


ROLL-OUT & IMPROVE PHASE
Of all the products I worked on at Atlassian, the learnings from this project were the most critical. A lot of hypotheses needed to be validated so the team and I kept a very close eye on the analytics & data science since it's release.


RESPONSIBILITIES
- Research
- UX
- UI
- Interaction
- Product Management
WHAT IS IT?
A growth initiative to remove a major hurdle that forced end users to request admin approval just to view and access a product (Jira, Confluence, etc).
Users today hit a dead end when they do not have access to a product they need to be in for better collaboration. They resolve this issue by reaching out to administrators offline to get access to the required container. Given that we do not disclose who the admin of the container is, it is even harder for end users to navigate all the hoops to gain access and be productive in their day-to-day work.
WHAT IS THE PROBLEM?
At a high level, the impact of the problem is,
- Users are unproductive & cannot get their work done.
- High friction for users to experience our product.
- Revenue loss, given that these users could be converted to product license users.
WHAT IS THE GOAL?
The goal of the project was to roll out an experiment and see what kind of data we could learn from, the two high level goals initially were,
- See an increase in admins who use this feature (when they have turned off other Invitation openness features)
- See an increase in conversion (25%) of users gaining access to product once they request access (when this feature was not enabled, we have seen a conversation of <10% of users gaining access to products)
Some of the assumptions we had and wanted to validate,
- Admins are open for users to request access to other products within their site
- Users know the product instance they want access to
WHAT IS THE PROCESS?
This project had a lot of stakeholders across multiple teams and products. The PMs on this project were very senior and controlled the stakeholder management through various streams of tight communication and updates to ensure everyone was aligned. This freed more time for me to focus on designs as this project had a very aggressive timeline.
Much like my other projects at Atlassian, the design process was broken down into a variant of the design thinking process all dependent on product scopes and timelines,
- Understand & Gather Phase
- My first growth project and the 3rd designer assigned to the project
- Used this time to gather context, understanding, identify dependencies and answer all assumptions (PMs, architects, back-end engineers, designers, etc)
- A lot of whiteboarding, summarizing past research and design efforts, and documenting current state (Confluence)
- Ideate Phase
- Explored the problem space and began high fidelity designs due to time constraints
- Did several prototypes and put them in front of stakeholders and customers for comprehension and basic task completions
- Refine Phase
- Finalized design based on stakeholder & customer feedback
- Rollout & Improve
- Learn! Rollout and learn was the most important aspect of this project
- Did a rollout plan 10/50/90/100 (beginning with 10% for 2 weeks) through LaunchDarkly for multi-products and observed bugs, data and user behaviors
CONCLUSION
Since this project began as a growth initiative, it was very important to track the data very closely. Fortunately, the project was a success in terms of both hitting business goals and providing user needs, we rolled it out 100% into production. The product was released on October 2018, and within 30 days, set a baseline of,
Unique user visits of 96,414:
- 58,262 came from user requests (60.43%)
- 43,984 were approved by admin (45.62%)
- 33,407 became new MAU -monthly active users (34.65%)
We tracked the analytics through amplitude, detailed results of the data can be seen in the posted screenshots. The request access project has moved on to milestone 2 (you can read more about the future phases above under product process and scope show more section).
TenX Product Details Page (PDP)
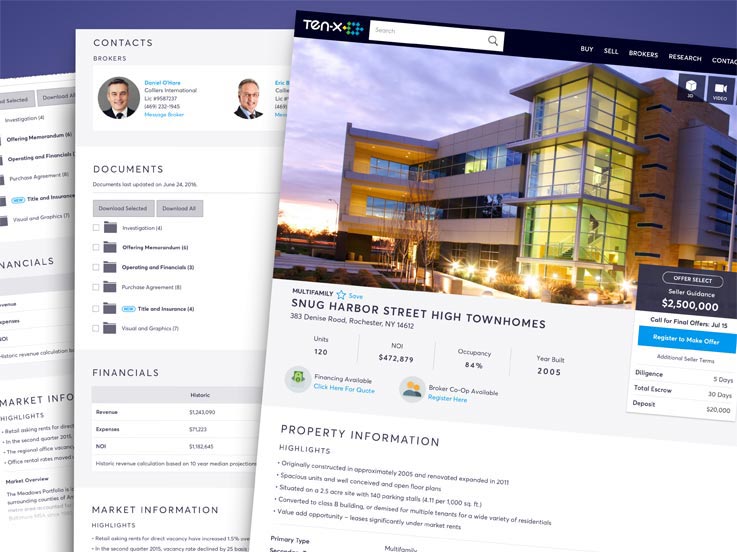
FINAL PRODUCT
Full Product Detail Page (PDP)


UNDERSTAND PHASE (Analytics, Research, User Testing)
I created user tasks and worked with the Customer Experience team to gather users for testing & feedback. I also worked with the analytics team to breakdown the current data.

UNDERSTAND PHASE (Whiteboarding)
I did several brainstorm sessions with the product team to define user needs, goals, constraints and assumptions. Other sessions include end-to-end experiences, uses cases, user journeys etc.

EXPLORE PHASE (Sketching)
I began ideations and sketching early UX, UI and IA explorations. The goal here is to prioritize information & content.

EXPLORE PHASE (Wireframes)
I created wireframes capturing the current experience first. Then using the research, data and user feedback from the understand phase, I created multiple UIs to determine information hierarchy.

EXPLORE PHASE (Wireframe Transitions)
I transitioned detailed wireframes to high fidelity visual design concepts. As wireframes help to determine information hierarchy, high fidelity helps to determine visual hierarchy.

EXPLORE PHASE (High Fidelity Designs)
I created a large variety of high fidelity UI designs for feedback and revisions. This gets into the weeds of visual design and help refine visual treatments such as eye tracking, typography, negative space, types, colors, page layout, etc.

EXPLORE PHASE (Interaction Design)
I created early interaction design flows to help communicate the vision to developers.

EXPLORE PHASE (Leveraging Data)
I used data and metrics as leverage to counter stakeholder opinions through visual communication.

EXPLORE PHASE (Visual Design)
I concurrently was keeping a detailed visual design log to introduce iconography and visual concepts for the Styleguide & Toolkit. The process to add or introduce new components into the toolkit can be arduous.

EXPLORE PHASE (Feedback)
I gathered internal feedback with outside product team members, e.g. finance PM, content strategist, etc.

EXPLORE PHASE (Feedback)
I held a design bash with the PDP product team and gathered feedback and go through any outstanding questions, concerns or issues.

EXPLORE PHASE (Prototype)
I prototyped a full fledged app in inVision and tested my multiple designs internally with various stakeholders for feedback & revisions.

MATERIALIZE PHASE (User Testing)
I then tested the final revised prototype with live users going back to the same list of tasks as the first round of testing to see if those same tasks were failing or successful. We also checked to see if it was resolving previous pain points and observing user behaviors.

MATERIALIZE PHASE (Implementation)
I provided developers with handoffs using toolkit redlines, using component call outs and block measurements.

MATERIALIZE PHASE (Implementation)
I also provided Zeplin format to aid with CSS for any visual design one-offs and other specificities.

RESPONSIBILITIES
- Research
- UX
- UI
- Interaction
- Visual
WHAT IS IT?
The Product Detail Page (PDP) is where the customer finds every detail about a particular asset. Anything from media (high resolution photographs, videos, maps, 3D tours, etc) to specific building details (financial information, building occupancy, year built etc) to miscellaneous information (triple net lease asset, platinum sellers, etc). The PDP tends to be the product page that helps determine whether a user will convert from a browser to a customer.
WHAT IS THE PROBLEM?
To answer this question, we must take a few small steps back to get a quick history of the PDP. In 2016, Ten-X went through a major rebrand and split the product into 3 lines of business.
- Wholesale Properties (foreclosure, bank owned, etc)
- Homes (consumer to consumer)
- Commercial (investors & consumers)
Prior to this split, all three lines of business were one product. Essentially meaning that we all shared one home/landing page, one search page, one dashboard, one PDP, etc. The need for the split was absolutely necessary as a one-all-be-all Search page or PDP page was extremely cluttered, hard to filter, and served completely different user needs. For example, a consumer searching for foreclosed properties in their local town is generally not going to be in the market for a million dollar office building in a major metropolis.
Hence, the absolute need for a detail page directed at specific behaviors and types of users.
WHAT IS THE GOAL?
The PDP had a few very specific high level goals:
- Help the user make decisions quickly (too cluttered, hard to navigate, difficult to find and digest information quickly, etc)
- Set up for future scale (optimize for mobile, ability to add and grow, etc)
- Modern design overhaul (updating the visual design but also improving on the UX/UI, etc)
Before designing a solution, we determined these goals by running research sessions and interviews with users. We also interviewed the Ten-X C-Suite (general manager, chief information officer, chief revenue officer, etc) and stakeholders (subject matter experts, business developers, client managers, etc) to gain a deeper understanding of the problem from all sides. We studied analytics in order to understand current user behavior. Based on these research sessions, data metrics and interviews, we developed a vision and strategy for the product team to begin the process.
WHAT IS THE PROCESS?
For the PDP re-design, I used a user centered design approach (keeping continuous tight feedback loops and iterating as necessary). The project was broken down as such,
Understand (Analytics, Research, User Testing & User Feedback, Whiteboarding & Brainstorming) > Explore (Sketching, Wireframes, Competitive & Design Analysis, High Fidelity Designs, Prototypes) > Materialize (Testing & Implementation)
The Understand Phase
- Empathize (Research, Analytics, User Testing, User Feedback)
- We (CX Team and I) brought in a group of users who had bid and won on our platform previously and ask them about specific pain points. We observed user behavior and asked them do a series of tasks. I also observed how they consume the complicated data, what was their process, what was most complicated, their bidding habits, etc (essentially observing their behaviors). A lot of time was also spent on breaking down analytics/metrics for the PDP.
- Define (Whiteboarding)
- I began brainstorming with the product manager in order to break down all research findings and identify problems. I did multiple whiteboard sessions where we brought in stakeholders and product team members. First meeting started with defining user needs, user goals, constraint and assumptions. Other sessions include end-to-end experiences, use cases, user journeys, etc.
The Explore Phase
- Ideate (Sketching, Wireframes, Competitive Analysis, High Fidelity Designs, Feedback)
- The ideation phase is the most intense from a design perspective. There were a lot of sketching, wireframing, high fidelity designs (lots of UI, UX, IA and interaction designs). This phase also included competitive and design analysis. This phase had the most feedback and iterations. This also included some unorthodox and organic feedback sessions with members outside of the product team and a design bash with the product team members (this is where we go through any outstanding questions, concerns or issues).
- Prototype
- I then created several fully functional prototypes and tested them internally with the PDP product team, design team and many of the stakeholders. The goal here was to get as much feedback as possible and fix any issues we may have missed before refining a final prototype to take back to live users for testing.
The Materialize Phase
- Test (User Testing & Feedback)
- I the took the final prototype for another round of live user testing. This new group was then asked to perform the same series of tasks as the first group of users, but now with the new designs. The CX team, myself and the PM then did a retrospective on all the data we had just acquired. This provided the clarity on whether we needed to tweak the design again or begin to clearly set a vision, strategy and finalizing our metrics for success.
- Implement (Handoffs & Deliverables)
- I fine tuned the designs by making sure all visuals assets were created and ready for deliverables. I also made sure that any use cases, edge cases or other complications were well communicated (and documented) within the engineers/QA and myself. During this phase, I communicated to my team that I was 100% available for any feedback, questions and sit-downs.
CONCLUSION
When the new PDP was release, I tracked the analytics very closely as it was important to me to see if how our metrics for success measured up. After 6 weeks, I gathered all data on the PDP from omniture, hotjar, etc. Fortunately, we had hit all of our primary and secondary metrics for success.
- Account Creations from PDP (pre 2.5% vs post 2.9%) for an 18% increase.
- Time Spent on PDP (pre 3.5 vs post 3.7) for a 4% increase.
- Bounce Rate on PDP (pre 26% vs post 24%) for a -11% decrease.
- Page Views per Visitor (pre 1.5 vs post 1.7) for a 13% increase.
- PDP Document Vault Downloads (pre 5.8% vs post 6.5%) for an 11% increase.
My personal retro is that the design challenges were the easier “hard” problems in the overall scheme of things. During this project I had to overcome bigger challenges such a major re-org, change in leadership (new General Manager, new Product Strategist, new CMO, Product manager leaving mid project, etc) and three team shuffles. Throughout all the challenges, we were able to release the PDP within the designated date. So overall, the PDP was deemed a success for the commercial business.
TenX Own It Now
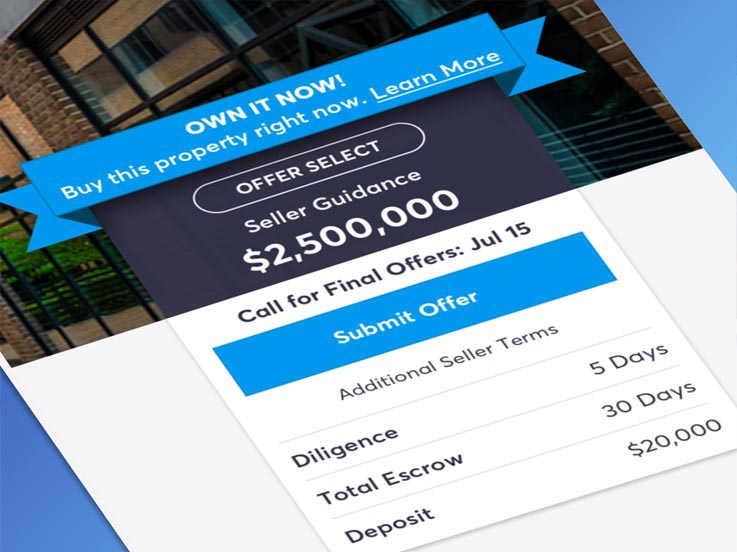
FINAL PRODUCT
Product Detail Page | Own-It-Now Feature

Product Detail Page | Own-It-Now Lightbox

I began by whiteboarding and ideating user goals, needs, constraints with my team.

I sketched early UI, UX explorations and potential interaction designs.

I then created high fidelity UX/UI matrix for team feedback and revisions.

I also created various high fidelity design UX/UI & visual treatments for stakeholder feedback.

I created a lightweight prototype through inVision to expedite quicker internal feedback.

I took the the internal feedback and created user tasks to test and gather actual live user feedback (working closely with the CX team).

RESPONSIBILITIES
- Research
- UX
- UI
- Visual Design
WHAT IS IT?
Own It Now is a new purchasing process (trademark pending) that offer buyers the ability to quickly close and own an asset rather than go through the typical lengthy offline negotiating terms.
The value proposition to the product is that, traditionally, this process is impossible offline. Real Estate, commercial real estate particularly, is an always negotiable and heavy diligence process. What Own It Now brings to the table is the ability to close the deal as is based on a set of clear terms (contingencies).
WHAT IS THE PROBLEM WE'RE TRYING TO SOLVE?
The concept of Own It Now is a passion project from our new General Manager, who is very adamant about building this product. This proposes stakeholder management challenges as objectivity can sometimes be skewed. From a product perspective, what we’re trying to validate as early as possible is, is their actual public user interest in the product? Rather than spend millions of dollars in company resources and time for a product that may not provide a user need, we decided to build a very slim product to test our hypothesis. By using a very lean UX methodology, we incorporated the following process:
- Quick feedback loops
- Rapid design iterations
- Early user testing
- Very lean dev cycle
WHO IS IT FOR?
We are working under two hypothesis as to whom the audience for this product is for:
- “1031” Buyers – These are users who recently sold commercial real estate and are under a strict timeline to re-purchase a property quickly in order to avoid tax implications. They are motivated buyers and handicapped by time.
- First Time Buyers – Commercial real estate is not a transparent game, most desirable offline purchases are done with brokers who are selective with clients. This process eliminates any biases, it’s a “first come first serve” policy.
WHAT IS THE PROCESS & GOAL?
By saying lean, I mean really lean. Our goal was to go from research, designs, iterations, user testing and development within two sprints (2 weeks each). This was also with a small team (1 designer, 1 product manager, 1 user researcher and 1 developer) whom we’re all dedicated on other products with tight deadlines as well.
Sprint 1
- Week 1 – Research sessions (whiteboarding, sketching, team feedback)
- Week 2 – High fidelity designs & prototype (sketching, re-iterating, team feedback)
Sprint 2
- Week 3 – Live user research feedback & dev framework (sketching, re-iterating, user and team feedback)
- Week 4 – Development & QA (no QA engineer, designer does quality assurance once pushed onto the DEV environment)
CONCLUSION
We were able to quickly release an MVP feature without having to invest months and millions of dollars of company time & resources building out a full fledge product. We build a test feature, and now can measure and learn. The test feature has gone live into production as of Q2 of 2017. The operations team was able to secure a real life asset (a Burger King in Phoenix, AZ) to have the Own It Now feature tested. This helped tremendously in validating some of our hypotheses about the product.
TenX Design System
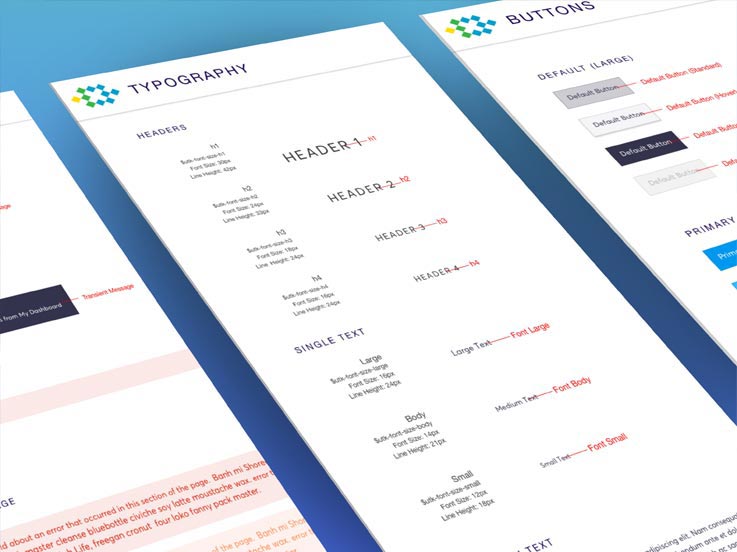
FINAL PRODUCT
Sample Pages of Styleguide/Toolkit (I created all the initial visuals and design patterns)


I created spec deliverables & consistency guidelines (Headers).

I worked on color explorations & visual design breakdowns.

I created toolkit variable labels & unit measurements for handoff consistency.

RESPONSIBILITIES
- Research
- UI
- Visual Design
WHAT IS IT?
The Design System is a set of standards that encourages design patterns, styles and consistency across the platform. These reusable components established proper design guidelines and handoffs for designers to funnel back to developers, as well as help to improve communication. The Toolkit itself is essentially a “codified” version of the Styleguide, which are all encompassed within the Design System.
WHAT IS THE PROBLEM?
When I first started at Ten-X, I was the sole designer working on multiple sprint teams. Each time I handed off deliverables, I was submitting a lot of the same visual styles, guidelines and specs. This was becoming extremely redundant for both myself and the developers. This process was completely inefficient and took away time from the designer and developer to solve bigger, more complicated problems.
WHAT IS THE GOAL?
The goal was to create a more seamless process. To create an efficient system for consistency, guidelines and deliverables. That’s when myself, the lead front end developer and product analyst decided to create the Styleguide/Toolkit counsel. We saw a need for efficiency, and as a group of 3 individuals on our own time organically started the counsel. We started by designing and codifying typography styles, iconography, and units with clear specifications and guidelines. Over time, the guide expanded and had designated designers/engineers owning & covering a range of items such as:
- Colors
- Headers / Footers
- Typography
- Units & Grids
- Padding & Spacing
- Messaging
- Tables
- Iconography
- Buttons
- Lightbox & Tooltips
- Etc
CONCLUSION
Over the course of 4 years, the Styleguide/Toolkit has grown to be adopted across the entire product through all 3 lines of business. During this time, the counsel team members and styleguide/toolkit itself has grown exponentially. Consisting now of over 25+ members and it’s own sprints to stay on top of all incoming/outgoing updates and changes. It’s helped designers facilitate deliverables and mitigate UI and visual design problems, giving them a chance to focus on bigger issues for the business like user needs and customer experiences.